Un gas de efecto invernadero (a veces abreviado como GEI ) es un gas que absorbe y emite energía radiante dentro del rango térmico infrarrojo , provocando el efecto invernadero . [1] Los principales gases de efecto invernadero en la atmósfera terrestre son el vapor de agua ( H
2O ), dióxido de carbono ( CO
2), metano ( CH
4), óxido nitroso ( N
2O ) y ozono ( O 3 ). Sin los gases de efecto invernadero, la temperatura promedio de la superficie de la Tierra sería de aproximadamente -18 ° C (0 ° F), [2] en lugar del promedio actual de 15 ° C (59 ° F). [3] [4] [5] Las atmósferas de Venus , Marte y Titán también contienen gases de efecto invernadero.


Las actividades humanas desde el comienzo de la Revolución Industrial (alrededor de 1750) han producido un aumento del 45% en la concentración atmosférica de dióxido de carbono , de 280 ppm en 1750 a 415 ppm en 2019. [6] La última vez que la concentración atmosférica de dióxido de carbono Fue tan alto fue hace más de 3 millones de años. [7] Este aumento se ha producido a pesar de la absorción de más de la mitad de las emisiones por varios "sumideros" naturales implicados en el ciclo del carbono . [8] [9]
En actuales de emisiones de gases de efecto invernadero tarifas, las temperaturas podrían aumentar en 2 ° C (3,6 ° F ), que las Naciones Unidas ' Panel Intergubernamental sobre el Cambio Climático (IPCC) designado como el límite superior para evitar niveles 'peligrosos', por 2036. [10 ] La gran mayoría de las emisiones antropogénicas de dióxido de carbono provienen de la combustión de combustibles fósiles , principalmente carbón , petróleo (incluido el petróleo ) y gas natural , con contribuciones adicionales provenientes de la deforestación y otros cambios en el uso de la tierra. [11] [12]
Gases en la atmósfera terrestre
Gases que no son de efecto invernadero
Los principales constituyentes de la atmósfera terrestre, el nitrógeno ( N
2) (78%), oxígeno ( O
2) (21%) y argón (Ar) (0,9%), no son gases de efecto invernadero porque las moléculas que contienen dos átomos del mismo elemento , como N
2y O
2no tienen ningún cambio neto en la distribución de sus cargas eléctricas cuando vibran, y los gases monoatómicos como el Ar no tienen modos vibratorios. Por lo tanto, casi no se ven afectados por la radiación infrarroja . Algunas moléculas que contienen solo dos átomos de elementos diferentes, como el monóxido de carbono (CO) y el cloruro de hidrógeno (HCl), absorben la radiación infrarroja, pero estas moléculas tienen una vida corta en la atmósfera debido a su reactividad o solubilidad . Por lo tanto, no contribuyen significativamente al efecto invernadero y, a menudo, se omiten cuando se habla de gases de efecto invernadero.
Gases de invernadero

Los gases de efecto invernadero son aquellos que absorben y emiten radiación infrarroja en el rango de longitud de onda emitida por la Tierra . [1] El dióxido de carbono (0,04%), el óxido nitroso, el metano y el ozono son gases traza que representan casi el 0,1% de la atmósfera terrestre y tienen un efecto invernadero apreciable.
En orden, los gases de efecto invernadero [ aclaración necesaria ] más abundantes en la atmósfera terrestre son: [13]
- Vapor de agua ( H
2O ) - Dióxido de carbono ( CO
2) - Metano ( CH
4) - Óxido nitroso ( N
2O ) - Ozono ( O
3) - Clorofluorocarbonos (CFC)
- Hidrofluorocarbonos (incluye HCFC y HFC)
Las concentraciones atmosféricas están determinadas por el equilibrio entre las fuentes (emisiones del gas de las actividades humanas y los sistemas naturales) y los sumideros (la eliminación del gas de la atmósfera mediante la conversión a un compuesto químico diferente o la absorción por cuerpos de agua). [14] La proporción de una emisión que permanece en la atmósfera después de un tiempo específico es la " fracción transportada por el aire " (AF). La fracción aérea anual es la relación entre el aumento atmosférico en un año dado y las emisiones totales de ese año. A partir de 2006, la fracción aérea anual de CO
2fue de aproximadamente 0,45. La fracción anual transportada por el aire aumentó a una tasa de 0,25 ± 0,21% por año durante el período 1959-2006. [15]
Efectos radiativos indirectos
Oxidación de CO a CO
2produce directamente un aumento inequívoco del forzamiento radiativo, aunque la razón es sutil. El pico de la emisión de infrarrojos térmica de la superficie de la Tierra está muy cerca de una fuerte banda de absorción vibratoria de CO
2( longitud de onda 15 micrones o número de onda 667 cm −1 ). Por otro lado, la banda vibratoria de CO única solo absorbe IR en longitudes de onda mucho más cortas (4,7 micrones, o 2145 cm -1 ), donde la emisión de energía radiante de la superficie de la Tierra es al menos un factor diez menor. Oxidación de metano a CO
2, que requiere reacciones con el radical OH, produce una reducción instantánea de la absorción y emisión radiativa ya que el CO
2es un gas de efecto invernadero más débil que el metano. Sin embargo, las oxidaciones de CO y CH
4están entrelazados ya que ambos consumen radicales OH. En cualquier caso, el cálculo del efecto radiativo total incluye forzamientos tanto directos como indirectos.
Un segundo tipo de efecto indirecto ocurre cuando las reacciones químicas en la atmósfera que involucran a estos gases cambian las concentraciones de gases de efecto invernadero. Por ejemplo, la destrucción de compuestos orgánicos volátiles distintos del metano (COVNM) en la atmósfera puede producir ozono. El tamaño del efecto indirecto puede depender en gran medida de dónde y cuándo se emite el gas. [17]
El metano tiene efectos indirectos además de formar CO
2. El principal químico que reacciona con el metano en la atmósfera es el radical hidroxilo (OH), por lo tanto, más metano significa que la concentración de OH disminuye. Efectivamente, el metano aumenta su propia vida atmosférica y, por lo tanto, su efecto radiativo general. La oxidación del metano puede producir tanto ozono como agua; y es una fuente importante de vapor de agua en la estratosfera normalmente seca . El CO y los COVNM producen CO
2cuando se oxidan. Eliminan el OH de la atmósfera y esto conduce a concentraciones más altas de metano. El efecto sorprendente de esto es que el potencial de calentamiento global del CO es tres veces mayor que el del CO
2. [18] El mismo proceso que convierte los COVNM en dióxido de carbono también puede conducir a la formación de ozono troposférico. Los halocarbonos tienen un efecto indirecto porque destruyen el ozono estratosférico. Finalmente, el hidrógeno puede conducir a la producción de ozono y CH
4aumenta además de producir vapor de agua estratosférico. [17]
Contribución de las nubes al efecto invernadero de la Tierra
El principal contribuyente no gaseoso al efecto invernadero de la Tierra, las nubes , también absorben y emiten radiación infrarroja y, por tanto, tienen un efecto sobre las propiedades radiativas de los gases de efecto invernadero. Las nubes son gotas de agua o cristales de hielo suspendidos en la atmósfera. [19] [20]
Papel del vapor de agua

El vapor de agua representa el mayor porcentaje del efecto invernadero, entre 36% y 66% para condiciones de cielo despejado y entre 66% y 85% cuando se incluyen nubes. [20] Las concentraciones de vapor de agua fluctúan regionalmente, pero la actividad humana no afecta directamente las concentraciones de vapor de agua, excepto a escalas locales, como cerca de campos irrigados. Indirectamente, la actividad humana que aumenta las temperaturas globales aumentará las concentraciones de vapor de agua, un proceso conocido como retroalimentación del vapor de agua. [21] La concentración atmosférica de vapor es muy variable y depende en gran medida de la temperatura, desde menos del 0,01% en regiones extremadamente frías hasta el 3% en masa en aire saturado a unos 32 ° C. [22] (Consulte Humedad relativa # Otros datos importantes ).
El tiempo medio de residencia de una molécula de agua en la atmósfera es de sólo nueve días, en comparación con los años o siglos de otros gases de efecto invernadero como el CH.
4y CO
2. [23] El vapor de agua responde y amplifica los efectos de otros gases de efecto invernadero. La relación Clausius-Clapeyron establece que habrá más vapor de agua por unidad de volumen a temperaturas elevadas. Este y otros principios básicos indican que el calentamiento asociado con el aumento de las concentraciones de los otros gases de efecto invernadero también aumentará la concentración de vapor de agua (suponiendo que la humedad relativa se mantenga aproximadamente constante; los estudios de modelación y observación encuentran que esto es así). Debido a que el vapor de agua es un gas de efecto invernadero, esto da como resultado un mayor calentamiento y, por lo tanto, una " retroalimentación positiva " que amplifica el calentamiento original. Eventualmente, otros procesos terrestres [ ¿cuáles? ] compensó estas retroalimentaciones positivas, estabilizando la temperatura global en un nuevo equilibrio y evitando la pérdida de agua de la Tierra a través de un efecto invernadero desbocado similar al de Venus . [21]
Impactos en el efecto invernadero general

La contribución de cada gas al efecto invernadero está determinada por las características de ese gas, su abundancia y los efectos indirectos que pueda causar. Por ejemplo, el efecto radiativo directo de una masa de metano es aproximadamente 84 veces más fuerte que la misma masa de dióxido de carbono durante un período de tiempo de 20 años [26], pero está presente en concentraciones mucho más pequeñas, por lo que su efecto radiativo directo total tiene hasta ahora ha sido más pequeño, en parte debido a su vida atmosférica más corta en ausencia de secuestro adicional de carbono . Por otro lado, además de su impacto radiativo directo, el metano tiene un gran efecto radiativo indirecto porque contribuye a la formación de ozono. Shindell y col. (2005) [27] sostiene que la contribución del metano al cambio climático es al menos el doble de las estimaciones previas como resultado de este efecto. [28]
Cuando se clasifican por su contribución directa al efecto invernadero, los más importantes son: [19] [ verificación fallida ]
| Compuesto | Fórmula | Concentración en la atmósfera [29] (ppm) | Contribución (%) |
|---|---|---|---|
| Vapor de agua y nubes | H 2O | 10–50 000 (A) | 36–72% |
| Dióxido de carbono | CO 2 | ~ 400 | 9-26% |
| Metano | CH 4 | ~ 1.8 | 4-9% |
| Ozono | O 3 | 2-8 (B) | 3-7% |
| notas: (A) El vapor de agua varía mucho a nivel local [30] | |||
Además de los principales gases de efecto invernadero enumerados anteriormente, otros gases de efecto invernadero incluyen hexafluoruro de azufre , hidrofluorocarbonos y perfluorocarbonos (consulte la lista del IPCC de gases de efecto invernadero ). Algunos gases de efecto invernadero no suelen aparecer en la lista. Por ejemplo, el trifluoruro de nitrógeno tiene un alto potencial de calentamiento global (GWP) pero solo está presente en cantidades muy pequeñas. [31]
Proporción de efectos directos en un momento dado
No es posible afirmar que un determinado gas provoque un porcentaje exacto del efecto invernadero. Esto se debe a que algunos de los gases absorben y emiten radiación en las mismas frecuencias que otros, por lo que el efecto invernadero total no es simplemente la suma de la influencia de cada gas. Los extremos superiores de los rangos indicados son para cada gas solo; los extremos inferiores tienen en cuenta las superposiciones con los otros gases. [19] [20] Además, se sabe que algunos gases, como el metano, tienen grandes efectos indirectos que aún se están cuantificando. [32]
Vida útil atmosférica
Aparte del vapor de agua , que tiene un tiempo de residencia de unos nueve días, [33] los principales gases de efecto invernadero están bien mezclados y tardan muchos años en salir de la atmósfera. [34] Aunque no es fácil saber con precisión cuánto tardan los gases de efecto invernadero en salir de la atmósfera, existen estimaciones de los principales gases de efecto invernadero. Jacob (1999) [35] define la vidade una especie atmosférica X en un modelo de una caja como el tiempo promedio que una molécula de X permanece en la caja. Matemáticamente se puede definir como la relación de la masa (en kg) de X en la caja a su tasa de remoción, que es la suma del flujo de X fuera de la caja (), pérdida química de X (), y la deposición de X () (todo en kg / s): . [35] Si cesaba la entrada de este gas en la caja, después de un tiempo, su concentración disminuiría en aproximadamente un 63%.


Por tanto, la vida atmosférica de una especie mide el tiempo necesario para restablecer el equilibrio tras un aumento o una disminución repentinos de su concentración en la atmósfera. Los átomos o moléculas individuales pueden perderse o depositarse en sumideros como el suelo, los océanos y otras aguas, o la vegetación y otros sistemas biológicos, reduciendo el exceso a concentraciones de fondo. El tiempo medio que se tarda en conseguirlo es la vida media .
El dióxido de carbono tiene una vida atmosférica variable y no se puede especificar con precisión. [36] [26] Aunque más de la mitad del CO
2emitido se elimina de la atmósfera en un siglo, una fracción (aproximadamente el 20%) del CO emitido
2permanece en la atmósfera durante muchos miles de años. [37] [38] [39] Problemas similares se aplican a otros gases de efecto invernadero, muchos de los cuales tienen una vida media más larga que el CO
2, por ejemplo, el N 2 O tiene una vida atmosférica media de 121 años. [26]
Forzamiento radiativo e índice anual de gases de efecto invernadero
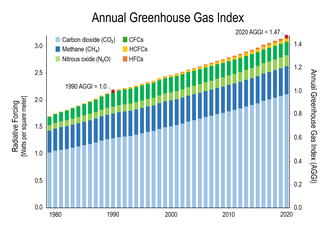
Earth absorbs some of the radiant energy received from the sun, reflects some of it as light and reflects or radiates the rest back to space as heat. Earth's surface temperature depends on this balance between incoming and outgoing energy. If this energy balance is shifted, Earth's surface becomes warmer or cooler, leading to a variety of changes in global climate.[42]
A number of natural and man-made mechanisms can affect the global energy balance and force changes in Earth's climate. Greenhouse gases are one such mechanism. Greenhouse gases absorb and emit some of the outgoing energy radiated from Earth's surface, causing that heat to be retained in the lower atmosphere.[42] As explained above, some greenhouse gases remain in the atmosphere for decades or even centuries, and therefore can affect Earth's energy balance over a long period. Radiative forcing quantifies (in Watts per square meter) the effect of factors that influence Earth's energy balance; including changes in the concentrations of greenhouse gases. Positive radiative forcing leads to warming by increasing the net incoming energy, whereas negative radiative forcing leads to cooling.[43]
The Annual Greenhouse Gas Index (AGGI) is defined by atmospheric scientists at NOAA as the ratio of total direct radiative forcing due to long-lived and well-mixed greenhouse gases for any year for which adequate global measurements exist, to that present in year 1990.[41][44] These radiative forcing levels are relative to those present in year 1750 (i.e. prior to the start of the industrial era). 1990 is chosen because it is the baseline year for the Kyoto Protocol, and is the publication year of the first IPCC Scientific Assessment of Climate Change. As such, NOAA states that the AGGI "measures the commitment that (global) society has already made to living in a changing climate. It is based on the highest quality atmospheric observations from sites around the world. Its uncertainty is very low."[45]
Global warming potential
The global warming potential (GWP) depends on both the efficiency of the molecule as a greenhouse gas and its atmospheric lifetime. GWP is measured relative to the same mass of CO
2 and evaluated for a specific timescale. Thus, if a gas has a high (positive) radiative forcing but also a short lifetime, it will have a large GWP on a 20-year scale but a small one on a 100-year scale. Conversely, if a molecule has a longer atmospheric lifetime than CO
2 its GWP will increase when the timescale is considered. Carbon dioxide is defined to have a GWP of 1 over all time periods.
Methane has an atmospheric lifetime of 12 ± 3 years. The 2007 IPCC report lists the GWP as 72 over a time scale of 20 years, 25 over 100 years and 7.6 over 500 years.[46] A 2014 analysis, however, states that although methane's initial impact is about 100 times greater than that of CO
2, because of the shorter atmospheric lifetime, after six or seven decades, the impact of the two gases is about equal, and from then on methane's relative role continues to decline.[47] The decrease in GWP at longer times is because methane is degraded to water and CO
2 through chemical reactions in the atmosphere.
Examples of the atmospheric lifetime and GWP relative to CO
2 for several greenhouse gases are given in the following table:
| Gas name | Chemical formula | Lifetime (years)[26] | Radiative Efficiency (Wm−2ppb−1, molar basis)[26] | Global warming potential (GWP) for given time horizon | ||
|---|---|---|---|---|---|---|
| 20-yr[26] | 100-yr[26] | 500-yr[46] | ||||
| Carbon dioxide | CO 2 | (A) | 1.37×10⁻⁵ | 1 | 1 | 1 |
| Methane | CH 4 | 12 | 3.63×10⁻⁴ | 84 | 28 | 7.6 |
| Nitrous oxide | N 2O | 121 | 3×10⁻³ | 264 | 265 | 153 |
| CFC-12 | CCl 2F 2 | 100 | 0.32 | 10 800 | 10 200 | 5 200 |
| HCFC-22 | CHClF 2 | 12 | 0.21 | 5 280 | 1 760 | 549 |
| Tetrafluoromethane | CF 4 | 50 000 | 0.09 | 4 880 | 6 630 | 11 200 |
| Hexafluoroethane | C 2F 6 | 10 000 | 0.25 | 8 210 | 11 100 | 18 200 |
| Sulfur hexafluoride | SF 6 | 3 200 | 0.57 | 17 500 | 23 500 | 32 600 |
| Nitrogen trifluoride | NF 3 | 500 | 0.20 | 12 800 | 16 100 | 20 700 |
| (A) No single lifetime for atmospheric CO2 can be given. | ||||||
The use of CFC-12 (except some essential uses) has been phased out due to its ozone depleting properties.[48] The phasing-out of less active HCFC-compounds will be completed in 2030.[49]
Fuentes naturales y antropogénicas

Aside from purely human-produced synthetic halocarbons, most greenhouse gases have both natural and human-caused sources. During the pre-industrial Holocene, concentrations of existing gases were roughly constant, because the large natural sources and sinks roughly balanced. In the industrial era, human activities have added greenhouse gases to the atmosphere, mainly through the burning of fossil fuels and clearing of forests.[52][53]
The 2007 Fourth Assessment Report compiled by the IPCC (AR4) noted that "changes in atmospheric concentrations of greenhouse gases and aerosols, land cover and solar radiation alter the energy balance of the climate system", and concluded that "increases in anthropogenic greenhouse gas concentrations is very likely to have caused most of the increases in global average temperatures since the mid-20th century".[54] In AR4, "most of" is defined as more than 50%.
Abbreviations used in the two tables below: ppm = parts-per-million; ppb = parts-per-billion; ppt = parts-per-trillion; W/m2 = watts per square metre
| Gas | Pre-1750 tropospheric concentration[56] | Recent tropospheric concentration[57] | Absolute increase since 1750 | Percentage increase since 1750 | Increased radiative forcing (W/m2)[58] |
|---|---|---|---|---|---|
| Carbon dioxide (CO 2) | 280 ppm[59] | 411 ppm[60] | 131 ppm | 47 % | 2.05[61] |
| Methane (CH 4) | 700 ppb[62] | 1893 ppb /[63][64] 1762 ppb[63] | 1193 ppb / 1062 ppb | 170.4% / 151.7% | 0.49 |
| Nitrous oxide (N 2O) | 270 ppb[58][65] | 326 ppb /[63] 324 ppb[63] | 56 ppb / 54 ppb | 20.7% / 20.0% | 0.17 |
| Tropospheric ozone (O 3) | 237 ppb[56] | 337 ppb[56] | 100 ppb | 42% | 0.4[66] |
| Gas | Recent tropospheric concentration | Increased radiative forcing (W/m2) |
|---|---|---|
| CFC-11 (trichlorofluoromethane) (CCl 3F) | 236 ppt / 234 ppt | 0.061 |
| CFC-12 (CCl 2F 2) | 527 ppt / 527 ppt | 0.169 |
| CFC-113 (Cl 2FC-CClF 2) | 74 ppt / 74 ppt | 0.022 |
| HCFC-22 (CHClF 2) | 231 ppt / 210 ppt | 0.046 |
| HCFC-141b (CH 3CCl 2F) | 24 ppt / 21 ppt | 0.0036 |
| HCFC-142b (CH 3CClF 2) | 23 ppt / 21 ppt | 0.0042 |
| Halon 1211 (CBrClF 2) | 4.1 ppt / 4.0 ppt | 0.0012 |
| Halon 1301 (CBrClF 3) | 3.3 ppt / 3.3 ppt | 0.001 |
| HFC-134a (CH 2FCF 3) | 75 ppt / 64 ppt | 0.0108 |
| Carbon tetrachloride (CCl 4) | 85 ppt / 83 ppt | 0.0143 |
| Sulfur hexafluoride (SF 6) | 7.79 ppt /[67] 7.39 ppt[67] | 0.0043 |
| Other halocarbons | Varies by substance | collectively 0.02 |
| Halocarbons in total | 0.3574 |

Ice cores provide evidence for greenhouse gas concentration variations over the past 800,000 years (see the following section). Both CO
2 and CH
4 vary between glacial and interglacial phases, and concentrations of these gases correlate strongly with temperature. Direct data does not exist for periods earlier than those represented in the ice core record, a record that indicates CO
2 mole fractions stayed within a range of 180 ppm to 280 ppm throughout the last 800,000 years, until the increase of the last 250 years. However, various proxies and modeling suggests larger variations in past epochs; 500 million years ago CO
2 levels were likely 10 times higher than now.[68] Indeed, higher CO
2 concentrations are thought to have prevailed throughout most of the Phanerozoic eon, with concentrations four to six times current concentrations during the Mesozoic era, and ten to fifteen times current concentrations during the early Palaeozoic era until the middle of the Devonian period, about 400 Ma.[69][70][71] The spread of land plants is thought to have reduced CO
2 concentrations during the late Devonian, and plant activities as both sources and sinks of CO
2 have since been important in providing stabilising feedbacks.[72] Earlier still, a 200-million year period of intermittent, widespread glaciation extending close to the equator (Snowball Earth) appears to have been ended suddenly, about 550 Ma, by a colossal volcanic outgassing that raised the CO
2 concentration of the atmosphere abruptly to 12%, about 350 times modern levels, causing extreme greenhouse conditions and carbonate deposition as limestone at the rate of about 1 mm per day.[73] This episode marked the close of the Precambrian eon, and was succeeded by the generally warmer conditions of the Phanerozoic, during which multicellular animal and plant life evolved. No volcanic carbon dioxide emission of comparable scale has occurred since. In the modern era, emissions to the atmosphere from volcanoes are approximately 0.645 billion tonnes of CO
2 per year, whereas humans contribute 29 billion tonnes of CO
2 each year.[74][73][75][76]
Ice cores
Measurements from Antarctic ice cores show that before industrial emissions started atmospheric CO
2 mole fractions were about 280 parts per million (ppm), and stayed between 260 and 280 during the preceding ten thousand years.[77] Carbon dioxide mole fractions in the atmosphere have gone up by approximately 35 percent since the 1900s, rising from 280 parts per million by volume to 387 parts per million in 2009. One study using evidence from stomata of fossilized leaves suggests greater variability, with carbon dioxide mole fractions above 300 ppm during the period seven to ten thousand years ago,[78] though others have argued that these findings more likely reflect calibration or contamination problems rather than actual CO
2 variability.[79][80] Because of the way air is trapped in ice (pores in the ice close off slowly to form bubbles deep within the firn) and the time period represented in each ice sample analyzed, these figures represent averages of atmospheric concentrations of up to a few centuries rather than annual or decadal levels.
Changes since the Industrial Revolution

2.

Since the beginning of the Industrial Revolution, the concentrations of many of the greenhouse gases have increased. For example, the mole fraction of carbon dioxide has increased from 280 ppm to 415 ppm, or 120 ppm over modern pre-industrial levels. The first 30 ppm increase took place in about 200 years, from the start of the Industrial Revolution to 1958; however the next 90 ppm increase took place within 56 years, from 1958 to 2014.[81][82]
Recent data also shows that the concentration is increasing at a higher rate. In the 1960s, the average annual increase was only 37% of what it was in 2000 through 2007.[83]
Total cumulative emissions from 1870 to 2017 were 425±20 GtC (1539 GtCO2) from fossil fuels and industry, and 180±60 GtC (660 GtCO2) from land use change. Land-use change, such as deforestation, caused about 31% of cumulative emissions over 1870–2017, coal 32%, oil 25%, and gas 10%.[84]
Today,[when?] the stock of carbon in the atmosphere increases by more than 3 million tonnes per annum (0.04%) compared with the existing stock.[clarification needed] This increase is the result of human activities by burning fossil fuels, deforestation and forest degradation in tropical and boreal regions.[85]
The other greenhouse gases produced from human activity show similar increases in both amount and rate of increase. Many observations are available online in a variety of Atmospheric Chemistry Observational Databases.
Anthropogenic greenhouse gas emissions
Since about 1750 human activity has increased the concentration of carbon dioxide and other greenhouse gases. As of 2001, measured atmospheric concentrations of carbon dioxide were 100 ppm higher than pre-industrial levels.[86][needs update] Natural sources of carbon dioxide are more than 20 times greater than sources due to human activity,[87] but over periods longer than a few years natural sources are closely balanced by natural sinks, mainly photosynthesis of carbon compounds by plants and marine plankton. As a result of this balance, the atmospheric mole fraction of carbon dioxide remained between 260 and 280 parts per million for the 10,000 years between the end of the last glacial maximum and the start of the industrial era.[88] Absorption of terrestrial infrared radiation by longwave absorbing gases such as these greenhouse gases make Earth an efficient[clarification needed] emitter. Therefore, in order for Earth to emit as much energy as is absorbed, global temperatures must increase.
It is likely that anthropogenic (human-induced) warming, such as that due to elevated greenhouse gas levels, has had a discernible influence on many physical and biological systems. [89] Warming is having a range of impacts, including sea level rise, [90] increased frequencies and severities of some extreme weather events, [90]loss of biodiversity, [91] and regional changes in agricultural productivity. [92]Eliminación de la atmósfera
Natural processes
Greenhouse gases can be removed from the atmosphere by various processes, as a consequence of:
- a physical change (condensation and precipitation remove water vapor from the atmosphere).
- a chemical reaction within the atmosphere. For example, methane is oxidized by reaction with naturally occurring hydroxyl radical, OH· and degraded to CO
2 and water vapor (CO
2 from the oxidation of methane is not included in the methane Global warming potential). Other chemical reactions include solution and solid phase chemistry occurring in atmospheric aerosols. - a physical exchange between the atmosphere and the other components of the planet. An example is the mixing of atmospheric gases into the oceans.
- a chemical change at the interface between the atmosphere and the other components of the planet. This is the case for CO
2, which is reduced by photosynthesis of plants, and which, after dissolving in the oceans, reacts to form carbonic acid and bicarbonate and carbonate ions (see ocean acidification). - a photochemical change. Halocarbons are dissociated by UV light releasing Cl· and F· as free radicals in the stratosphere with harmful effects on ozone (halocarbons are generally too stable to disappear by chemical reaction in the atmosphere).
Negative emissions
A number of technologies remove greenhouse gases emissions from the atmosphere. Most widely analysed are those that remove carbon dioxide from the atmosphere, either to geologic formations such as bio-energy with carbon capture and storage and carbon dioxide air capture,[93] or to the soil as in the case with biochar.[93] The IPCC has pointed out that many long-term climate scenario models require large-scale man-made negative emissions to avoid serious climate change.[94]
Historia de la investigación científica
In the late 19th century scientists experimentally discovered that N
2 and O
2 do not absorb infrared radiation (called, at that time, "dark radiation"), while water (both as true vapor and condensed in the form of microscopic droplets suspended in clouds) and CO
2 and other poly-atomic gaseous molecules do absorb infrared radiation.[95][96] In the early 20th century researchers realized that greenhouse gases in the atmosphere made Earth's overall temperature higher than it would be without them. During the late 20th century, a scientific consensus evolved that increasing concentrations of greenhouse gases in the atmosphere cause a substantial rise in global temperatures and changes to other parts of the climate system,[97] with consequences for the environment and for human health.
Ver también
- Attribution of recent climate change
- Cap and Trade
- Carbon accounting
- Carbon credit
- Carbon neutrality
- Carbon offset
- Carbon tax
- Greenhouse debt
- Hydrogen economy
- Integrated Carbon Observation System
- Low-carbon economy
- Paris Agreement
- Perfluorotributylamine
- Physical properties of greenhouse gases
- Sustainability measurement
- Waste management
- Zero-emissions vehicle
Referencias
- ^ a b "IPCC AR4 SYR Appendix Glossary" (PDF). Archived from the original (PDF) on 17 November 2018. Retrieved 14 December 2008.
- ^ "NASA GISS: Science Briefs: Greenhouse Gases: Refining the Role of Carbon Dioxide". www.giss.nasa.gov. Retrieved 26 April 2016.
- ^ Karl TR, Trenberth KE (2003). "Modern global climate change". Science. 302 (5651): 1719–23. Bibcode:2003Sci...302.1719K. doi:10.1126/science.1090228. PMID 14657489. S2CID 45484084.
- ^ Le Treut H.; Somerville R.; Cubasch U.; Ding Y.; Mauritzen C.; Mokssit A.; Peterson T.; Prather M. Historical overview of climate change science (PDF). Retrieved 14 December 2008. in IPCC AR4 WG1 (2007)
- ^ "NASA Science Mission Directorate article on the water cycle". Nasascience.nasa.gov. Archived from the original on 17 January 2009. Retrieved 16 October 2010.
- ^ "CO2 in the atmosphere just exceeded 415 parts per million for the first time in human history". Retrieved 31 August 2019.
- ^ "Climate Change: Atmospheric Carbon Dioxide | NOAA Climate.gov". www.climate.gov. Retrieved 2 March 2020.
- ^ "Frequently asked global change questions". Carbon Dioxide Information Analysis Center.
- ^ ESRL Web Team (14 January 2008). "Trends in carbon dioxide". Esrl.noaa.gov. Retrieved 11 September 2011.
- ^ Mann, Michael E. (1 April 2014). "Earth Will Cross the Climate Danger Threshold by 2036". Scientific American. Retrieved 30 August 2016.
- ^ "Global Greenhouse Gas Emissions Data". U.S. Environmental Protection Agency. Retrieved 30 December 2019.
The burning of coal, natural gas, and oil for electricity and heat is the largest single source of global greenhouse gas emissions.
- ^ "AR4 SYR Synthesis Report Summary for Policymakers – 2 Causes of change". ipcc.ch. Archived from the original on 28 February 2018. Retrieved 9 October 2015.
- ^ "Inside the Earth's invisible blanket". sequestration.org. Retrieved 5 March 2021.
- ^ "FAQ 7.1". p. 14. in IPCC AR4 WG1 (2007)
- ^ Canadell, J.G.; Le Quere, C.; Raupach, M.R.; Field, C.B.; Buitenhuis, E.T.; Ciais, P.; Conway, T.J.; Gillett, N.P.; Houghton, R.A.; Marland, G. (2007). "Contributions to accelerating atmospheric CO2 growth from economic activity, carbon intensity, and efficiency of natural sinks". Proc. Natl. Acad. Sci. USA. 104 (47): 18866–70. Bibcode:2007PNAS..10418866C. doi:10.1073/pnas.0702737104. PMC 2141868. PMID 17962418.
- ^ "The Chemistry of Earth's Atmosphere". Earth Observatory. NASA. Archived from the original on 20 September 2008.
- ^ a b Forster, P.; et al. (2007). "2.10.3 Indirect GWPs". Changes in Atmospheric Constituents and in Radiative Forcing. Contribution of Working Group I to the Fourth Assessment Report of the Intergovernmental Panel on Climate Change. Cambridge University Press. Retrieved 2 December 2012.
- ^ MacCarty, N. "Laboratory Comparison of the Global-Warming Potential of Six Categories of Biomass Cooking Stoves" (PDF). Approvecho Research Center. Archived from the original (PDF) on 11 November 2013.
- ^ a b c Kiehl, J.T.; Kevin E. Trenberth (1997). "Earth's annual global mean energy budget". Bulletin of the American Meteorological Society. 78 (2): 197–208. Bibcode:1997BAMS...78..197K. doi:10.1175/1520-0477(1997)078<0197:EAGMEB>2.0.CO;2.
- ^ a b c "Water vapour: feedback or forcing?". RealClimate. 6 April 2005. Retrieved 1 May 2006.
- ^ a b Held, Isaac M.; Soden, Brian J. (November 2000). "Water vapor feedback and global warming". Annual Review of Energy and the Environment. 25 (1): 441–475. CiteSeerX 10.1.1.22.9397. doi:10.1146/annurev.energy.25.1.441. ISSN 1056-3466.
- ^ Evans, Kimberly Masters (2005). "The greenhouse effect and climate change". The environment: a revolution in attitudes. Detroit: Thomson Gale. ISBN 978-0787690823.
- ^ "Inventory of U.S. Greenhouse Gas Emissions and Sinks: 1990–2010". U.S. Environmental Protection Agency. 15 April 2012. p. 1.4. Retrieved 30 December 2019.
- ^ Schmidt, G.A.; R. Ruedy; R.L. Miller; A.A. Lacis (2010), "The attribution of the present-day total greenhouse effect" (PDF), J. Geophys. Res., 115 (D20), pp. D20106, Bibcode:2010JGRD..11520106S, doi:10.1029/2010JD014287, archived from the original (PDF) on 22 October 2011, D20106. Web page
- ^ Lacis, A. (October 2010), NASA GISS: CO2: The Thermostat that Controls Earth's Temperature, New York: NASA GISS
- ^ a b c d e f g "Appendix 8.A" (PDF). Intergovernmental Panel on Climate Change Fifth Assessment Report. p. 731.
- ^ Shindell, Drew T. (2005). "An emissions-based view of climate forcing by methane and tropospheric ozone". Geophysical Research Letters. 32 (4): L04803. Bibcode:2005GeoRL..32.4803S. doi:10.1029/2004GL021900.
- ^ "Methane's Impacts on Climate Change May Be Twice Previous Estimates". Nasa.gov. 30 November 2007. Retrieved 16 October 2010.
- ^ "Climate Change Indicators: Atmospheric Concentrations of Greenhouse Gases". Climate Change Indicators. United States Environmental Protection Agency. 27 June 2016. Retrieved 20 January 2017.
- ^ Wallace, John M. and Peter V. Hobbs. Atmospheric Science; An Introductory Survey. Elsevier. Second Edition, 2006. ISBN 978-0127329512. Chapter 1
- ^ Prather, Michael J.; J Hsu (2008). "NF3, the greenhouse gas missing from Kyoto". Geophysical Research Letters. 35 (12): L12810. Bibcode:2008GeoRL..3512810P. doi:10.1029/2008GL034542.
- ^ Isaksen, Ivar S.A.; Michael Gauss; Gunnar Myhre; Katey M. Walter Anthony; Carolyn Ruppel (20 April 2011). "Strong atmospheric chemistry feedback to climate warming from Arctic methane emissions" (PDF). Global Biogeochemical Cycles. 25 (2): n/a. Bibcode:2011GBioC..25.2002I. doi:10.1029/2010GB003845. hdl:1912/4553. Archived from the original (PDF) on 4 March 2016. Retrieved 29 July 2011.
- ^ "AGU Water Vapor in the Climate System". Eso.org. 27 April 1995. Retrieved 11 September 2011.
- ^ Betts (2001). "6.3 Well-mixed Greenhouse Gases". Chapter 6 Radiative Forcing of Climate Change. Working Group I: The Scientific Basis IPCC Third Assessment Report – Climate Change 2001. UNEP/GRID-Arendal – Publications. Archived from the original on 29 June 2011. Retrieved 16 October 2010.
- ^ a b Jacob, Daniel (1999). Introduction to atmospheric chemistry. Princeton University Press. pp. 25–26. ISBN 978-0691001852. Archived from the original on 2 September 2011.
- ^ "How long will global warming last?". RealClimate. Retrieved 12 June 2012.
- ^ "Frequently Asked Question 10.3: If emissions of greenhouse gases are reduced, how quickly do their concentrations in the atmosphere decrease?". Global Climate Projections. Archived from the original on 24 December 2011. Retrieved 1 June 2011. in IPCC AR4 WG1 (2007)
- ^ See also: Archer, David (2005). "Fate of fossil fuel CO2 in geologic time" (PDF). Journal of Geophysical Research. 110 (C9): C09S05.1–6. Bibcode:2005JGRC..11009S05A. doi:10.1029/2004JC002625. Retrieved 27 July 2007.
- ^ See also: Caldeira, Ken; Wickett, Michael E. (2005). "Ocean model predictions of chemistry changes from carbon dioxide emissions to the atmosphere and ocean" (PDF). Journal of Geophysical Research. 110 (C9): C09S04.1–12. Bibcode:2005JGRC..11009S04C. doi:10.1029/2004JC002671. Archived from the original (PDF) on 10 August 2007. Retrieved 27 July 2007.
- ^ "Annual Greenhouse Gas Index". U.S. Global Change Research Program. Retrieved 5 September 2020.
- ^ a b Butler J. and Montzka S. (2020). "The NOAA Annual Greenhouse Gas Index (AGGI)". NOAA Global Monitoring Laboratory/Earth System Research Laboratories.
- ^ a b "Climate Change Indicators in the United States - Greenhouse Gases". U.S. Environmental Protection Agency (EPA). 2016..
- ^ "Climate Change Indicators in the United States - Climate Forcing". U.S. Environmental Protection Agency (EPA). 2016.[1]
- ^ LuAnn Dahlman (14 August 2020). "Climate change: annual greenhouse gas index". NOAA Climate.gov science news & Information for a climate smart nation.
- ^ "The NOAA Annual Greenhouse Gas Index (AGGI) - An Introduction". NOAA Global Monitoring Laboratory/Earth System Research Laboratories. Retrieved 5 September 2020.
- ^ a b "Table 2.14" (PDF). IPCC Fourth Assessment Report. p. 212.
- ^ Chandler, David L. "How to count methane emissions". MIT News. Retrieved 20 August 2018. Referenced paper is Trancik, Jessika; Edwards, Morgan (25 April 2014). "Climate impacts of energy technologies depend on emissions timing" (PDF). Nature Climate Change. 4 (5): 347. Bibcode:2014NatCC...4..347E. doi:10.1038/nclimate2204. hdl:1721.1/96138. Archived from the original (PDF) on 16 January 2015. Retrieved 15 January 2015.
- ^ Vaara, Miska (2003), Use of ozone depleting substances in laboratories, TemaNord, p. 170, ISBN 978-9289308847, archived from the original on 6 August 2011
- ^ Montreal Protocol
- ^ St. Fleur, Nicholas (10 November 2015). "Atmospheric Greenhouse Gas Levels Hit Record, Report Says". New York Times. Retrieved 11 November 2015.
- ^ Ritter, Karl (9 November 2015). "UK: In 1st, global temps average could be 1 degree C higher". AP News. Retrieved 11 November 2015.
- ^ "Historical Overview of Climate Change Science – FAQ 1.3 Figure 1" (PDF). p. 116. in IPCC AR4 WG1 (2007)
- ^ "Chapter 3, IPCC Special Report on Emissions Scenarios, 2000" (PDF). Intergovernmental Panel on Climate Change. 2000. Retrieved 16 October 2010.
- ^ Intergovernmental Panel on Climate Change (17 November 2007). "Climate Change 2007: Synthesis Report" (PDF). p. 5. Retrieved 20 January 2017.
- ^ a b Blasing (2013)
- ^ a b c Ehhalt, D.; et al., "Table 4.1", Atmospheric Chemistry and Greenhouse Gases, archived from the original on 3 January 2013, in IPCC TAR WG1 (2001), pp. 244–45. Referred to by: Blasing (2013). Based on Blasing (2013): Pre-1750 concentrations of CH4,N2O and current concentrations of O3, are taken from Table 4.1 (a) of the IPCC Intergovernmental Panel on Climate Change, 2001. Following the convention of IPCC (2001), inferred global-scale trace-gas concentrations from prior to 1750 are assumed to be practically uninfluenced by human activities such as increasingly specialized agriculture, land clearing, and combustion of fossil fuels. Preindustrial concentrations of industrially manufactured compounds are given as zero. The short atmospheric lifetime of ozone (hours-days) together with the spatial variability of its sources precludes a globally or vertically homogeneous distribution, so that a fractional unit such as parts per billion would not apply over a range of altitudes or geographical locations. Therefore a different unit is used to integrate the varying concentrations of ozone in the vertical dimension over a unit area, and the results can then be averaged globally. This unit is called a Dobson Unit (D.U.), after G.M.B. Dobson, one of the first investigators of atmospheric ozone. A Dobson unit is the amount of ozone in a column that, unmixed with the rest of the atmosphere, would be 10 micrometers thick at standard temperature and pressure.
- ^ Because atmospheric concentrations of most gases tend to vary systematically over the course of a year, figures given represent averages over a 12-month period for all gases except ozone (O3), for which a current global value has been estimated (IPCC, 2001, Table 4.1a). CO
2 averages for year 2012 are taken from the National Oceanic and Atmospheric Administration, Earth System Research Laboratory, web site: www.esrl.noaa.gov/gmd/ccgg/trends maintained by Dr. Pieter Tans. For other chemical species, the values given are averages for 2011. These data are found on the CDIAC AGAGE web site: http://cdiac.ornl.gov/ndps/alegage.html or the AGAGE home page: http://agage.eas.gatech.edu. - ^ a b Forster, P.; et al., "Table 2.1", Changes in Atmospheric Constituents and in Radiative Forcing, archived from the original on 12 October 2012, retrieved 30 October 2012, in IPCC AR4 WG1 (2007), p. 141. Referred to by: Blasing (2013)
- ^ Prentice, I.C.; et al. "Executive summary". The Carbon Cycle and Atmospheric Carbon Dioxide. Archived from the original on 7 December 2009., in IPCC TAR WG1 (2001), p. 185. Referred to by: Blasing (2013)
- ^ "Carbon dioxide levels continue at record levels, despite COVID-19 lockdown". WMO.int. World Meteorological Organization. 23 November 2020. Archived from the original on 1 December 2020.
- ^ IPCC AR4 WG1 (2007), p. 140:"The simple formulae ... in Ramaswamy et al. (2001) are still valid. and give an RF of +3.7 W m–2 for a doubling in the CO2 mixing ratio. ... RF increases logarithmically with mixing ratio" Calculation: ln(new ppm/old ppm)/ln(2)*3.7
- ^ ppb = parts-per-billion
- ^ a b c d The first value in a cell represents Mace Head, Ireland, a mid-latitude Northern-Hemisphere site, while the second value represents Cape Grim, Tasmania, a mid-latitude Southern-Hemisphere site. "Current" values given for these gases are annual arithmetic averages based on monthly background concentrations for year 2011. The SF
6 values are from the AGAGE gas chromatography – mass spectrometer (gc-ms) Medusa measuring system. - ^ "Advanced Global Atmospheric Gases Experiment (AGAGE)". Data compiled from finer time scales in the Prinn; etc (2000). "ALE/GAGE/AGAGE database".
- ^ The pre-1750 value for N
2O is consistent with ice-core records from 10,000 BCE through 1750 CE: "Summary for policymakers", Figure SPM.1, IPCC, in IPCC AR4 WG1 (2007), p. 3. Referred to by: Blasing (2013) - ^ Changes in stratospheric ozone have resulted in a decrease in radiative forcing of 0.05 W/m2: Forster, P.; et al., "Table 2.12", Changes in Atmospheric Constituents and in Radiative Forcing, archived from the original on 28 January 2013, retrieved 30 October 2012, in IPCC AR4 WG1 (2007), p. 204. Referred to by: Blasing (2013)
- ^ a b "SF6 data from January 2004"."Data from 1995 through 2004". National Oceanic and Atmospheric Administration (NOAA), Halogenated and other Atmospheric Trace Species (HATS).Sturges, W.T.; et al. "Concentrations of SF6 from 1970 through 1999, obtained from Antarctic firn (consolidated deep snow) air samples".
- ^ File:Phanerozoic Carbon Dioxide.png
- ^ Berner, Robert A. (January 1994). "GEOCARB II: a revised model of atmospheric CO2 over Phanerozoic time" (PDF). American Journal of Science. 294 (1): 56–91. Bibcode:1994AmJS..294...56B. doi:10.2475/ajs.294.1.56.[permanent dead link]
- ^ Royer, D.L.; R.A. Berner; D.J. Beerling (2001). "Phanerozoic atmospheric CO
2 change: evaluating geochemical and paleobiological approaches". Earth-Science Reviews. 54 (4): 349–92. Bibcode:2001ESRv...54..349R. doi:10.1016/S0012-8252(00)00042-8. - ^ Berner, Robert A.; Kothavala, Zavareth (2001). "GEOCARB III: a revised model of atmospheric CO2 over Phanerozoic time" (PDF). American Journal of Science. 301 (2): 182–204. Bibcode:2001AmJS..301..182B. CiteSeerX 10.1.1.393.582. doi:10.2475/ajs.301.2.182. Archived from the original (PDF) on 6 August 2004.
- ^ Beerling, D.J.; Berner, R.A. (2005). "Feedbacks and the co-evolution of plants and atmospheric CO2". Proc. Natl. Acad. Sci. USA. 102 (5): 1302–05. Bibcode:2005PNAS..102.1302B. doi:10.1073/pnas.0408724102. PMC 547859. PMID 15668402.
- ^ a b Hoffmann, PF; AJ Kaufman; GP Halverson; DP Schrag (1998). "A neoproterozoic snowball earth". Science. 281 (5381): 1342–46. Bibcode:1998Sci...281.1342H. doi:10.1126/science.281.5381.1342. PMID 9721097. S2CID 13046760.
- ^ Siegel, Ethan. "How Much CO2 Does A Single Volcano Emit?". Forbes. Retrieved 6 September 2018.
- ^ Gerlach, TM (1991). "Present-day CO
2 emissions from volcanoes". Transactions of the American Geophysical Union. 72 (23): 249–55. Bibcode:1991EOSTr..72..249.. doi:10.1029/90EO10192. - ^ See also: "U.S. Geological Survey". 14 June 2011. Retrieved 15 October 2012.
- ^ Flückiger, Jacqueline (2002). "High-resolution Holocene N2O ice core record and its relationship with CH4 and CO2". Global Biogeochemical Cycles. 16: 1010. Bibcode:2002GBioC..16a..10F. doi:10.1029/2001GB001417.
- ^ Friederike Wagner; Bent Aaby; Henk Visscher (2002). "Rapid atmospheric CO2 changes associated with the 8,200-years-B.P. cooling event". Proc. Natl. Acad. Sci. USA. 99 (19): 12011–14. Bibcode:2002PNAS...9912011W. doi:10.1073/pnas.182420699. PMC 129389. PMID 12202744.
- ^ Andreas Indermühle; Bernhard Stauffer; Thomas F. Stocker (1999). "Early Holocene Atmospheric CO2 Concentrations". Science. 286 (5446): 1815. doi:10.1126/science.286.5446.1815a.IndermÜhle, A (1999). "Early Holocene atmospheric CO2 concentrations". Science. 286 (5446): 1815a–15. doi:10.1126/science.286.5446.1815a.
- ^ H. J. Smith; M. Wahlen; D. Mastroianni (1997). "The CO
2 concentration of air trapped in GISP2 ice from the Last Glacial Maximum-Holocene transition". Geophysical Research Letters. 24 (1): 1–4. Bibcode:1997GeoRL..24....1S. doi:10.1029/96GL03700. - ^ Charles J. Kibert (2016). "Background". Sustainable Construction: Green Building Design and Delivery. Wiley. ISBN 978-1119055327.
- ^ "Full Mauna Loa CO2 record". Earth System Research Laboratory. 2005. Retrieved 6 May 2017.
- ^ Tans, Pieter (3 May 2008). "Annual CO2 mole fraction increase (ppm) for 1959–2007". National Oceanic and Atmospheric Administration Earth System Research Laboratory, Global Monitoring Division."additional details".; see also Masarie, K.A.; Tans, P.P. (1995). "Extension and integration of atmospheric carbon dioxide data into a globally consistent measurement record". J. Geophys. Res. 100 (D6): 11593–610. Bibcode:1995JGR...10011593M. doi:10.1029/95JD00859.
- ^ "Global Carbon Project (GCP)". www.globalcarbonproject.org. Archived from the original on 4 April 2019. Retrieved 19 May 2019.
- ^ Dumitru-Romulus Târziu; Victor-Dan Păcurar (January 2011). "Pădurea, climatul și energia". Rev. pădur. (in Romanian). 126 (1): 34–39. ISSN 1583-7890. 16720. Archived from the original on 16 April 2013. Retrieved 11 June 2012.(webpage has a translation button)
- ^ "Climate Change 2001: Working Group I: The Scientific Basis: figure 6-6". Archived from the original on 14 June 2006. Retrieved 1 May 2006.
- ^ "The present carbon cycle – Climate Change". Grida.no. Retrieved 16 October 2010.
- ^ Couplings Between Changes in the Climate System and Biogeochemistry (PDF). Retrieved 13 May 2008. in IPCC AR4 WG1 (2007)
- ^ IPCC (2007d). "6.1 Observed changes in climate and their effects, and their causes". 6 Robust findings, key uncertainties. Climate Change 2007: Synthesis Report. A Contribution of Working Groups I, II, and III to the Fourth Assessment Report of the Intergovernmental Panel on Climate Change (IPCC). Geneva: IPCC. Archived from the original on 6 November 2012. Retrieved 4 September 2012.
- ^ a b "6.2 Drivers and projections of future climate changes and their impacts". 6 Robust findings, key uncertainties. Climate Change 2007: Synthesis Report. A Contribution of Working Groups I, II, and III to the Fourth Assessment Report of the Intergovernmental Panel on Climate Change (IPCC). Geneva, Switzerland: IPCC. 2007d. Archived from the original on 6 November 2012. Retrieved 4 September 2012.
- ^ Armarego-Marriott, Tegan (May 2020). "Climate or biodiversity?". Nature Climate Change. 10 (5): 385. Bibcode:2020NatCC..10..385A. doi:10.1038/s41558-020-0780-6. ISSN 1758-6798. S2CID 217192647.
- ^ "3.3.1 Impacts on systems and sectors". 3 Climate change and its impacts in the near and long term under different scenarios. Climate Change 2007: Synthesis Report. A Contribution of Working Groups I, II, and III to the Fourth Assessment Report of the Intergovernmental Panel on Climate Change (IPCC). Geneva: IPCC. 2007d. Archived from the original on 3 November 2018. Retrieved 31 August 2012.
- ^ a b "Geoengineering the climate: science, governance and uncertainty". The Royal Society. 2009. Archived from the original on 7 September 2009. Retrieved 12 September 2009.
- ^ Fischer, B.S.; Nakicenovic, N.; Alfsen, K.; Morlot, J. Corfee; de la Chesnaye, F.; Hourcade, J.-Ch.; Jiang, K.; Kainuma, M.; La Rovere, E.; Matysek, A.; Rana, A.; Riahi, K.; Richels, R.; Rose, S.; van Vuuren, D.; Warren, R., Issues related to mitigation in the long term context (PDF) in Rogner et al. (2007)
- ^ Arrhenius, Svante (1896). "On the influence of carbonic acid in the air upon the temperature of the ground" (PDF). The London, Edinburgh, and Dublin Philosophical Magazine and Journal of Science. 41 (251): 237–276. doi:10.1080/14786449608620846.
- ^ Arrhenius, Svante (1897). "On the Influence of Carbonic Acid in the Air Upon the Temperature of the Ground". Publications of the Astronomical Society of the Pacific. 9 (54): 14. Bibcode:1897PASP....9...14A. doi:10.1086/121158.
- ^ Cook, J.; Nuccitelli, D.; Green, S.A.; Richardson, M.; Winkler, B.R.; Painting, R.; Way, R.; Jacobs, P.; Skuce, A. (2013). "Quantifying the consensus on anthropogenic global warming in the scientific literature" (PDF). Environmental Research Letters. 8 (2): 024024. Bibcode:2013ERL.....8b4024C. doi:10.1088/1748-9326/8/2/024024.[permanent dead link]
Otras lecturas
- Blasing, T.J. (February 2013), Current Greenhouse Gas Concentrations, doi:10.3334/CDIAC/atg.032, archived from the original on 16 July 2011, retrieved 30 October 2012
- IPCC AR4 WG1 (2007), Solomon, S.; Qin, D.; Manning, M.; Chen, Z.; Marquis, M.; Averyt, K.B.; Tignor, M.; Miller, H.L. (eds.), Climate Change 2007: The Physical Science Basis – Contribution of Working Group I (WG1) to the Fourth Assessment Report (AR4) of the Intergovernmental Panel on Climate Change (IPCC), Cambridge University Press, ISBN 978-0521880091 (pb: ISBN 978-0521705967)
- Rogner, H.-H.; Zhou, D.; Bradley, R.; Crabbé, P.; Edenhofer, O.; Hare, B.; Kuijpers, L.; Yamaguchi, M. (2007), B. Metz; O.R. Davidson; P.R. Bosch; R. Dave; L.A. Meyer (eds.), Climate Change 2007: Mitigation. Contribution of Working Group III to the Fourth Assessment Report of the Intergovernmental Panel on Climate Change, Cambridge University Press, ISBN 978-0521880114, archived from the original on 21 January 2012, retrieved 14 January 2012
enlaces externos
- Carbon Dioxide Information Analysis Center (CDIAC), U.S. Department of Energy, retrieved 26 July 2020
- The official greenhouse gas emissions data of developed countries from the UNFCCC
- Greenhouse gas at Curlie
- Annual Greenhouse Gas Index (AGGI) from NOAA
- Atmospheric spectra of GHGs and other trace gases