| Demografía de los Países Bajos | |
|---|---|
 pirámide de población 2017 | |
| Población | 17.474.677 (31 de diciembre de 2020) ( 67o ) |
| Densidad | 424 por km 2 ( 16º ) |
| Tasa de crecimiento | 0,29% ( 155º ) |
| Tasa de natalidad | 9,8 nacimientos / 1.000 ( 161º ) |
| Índice de mortalidad | 8.8 muertes / 1,000 ( 77 ° ) |
| Esperanza de vida | 82,1 años ( 16º ) |
| • masculino | 80,4 años |
| • mujer | 83,8 años |
| Tasa de fertilidad | 1.574 niños / mujer (2019) |
| Estructura por edades | |
| 0-14 años | 16,1% |
| 15 a 64 años | 64,1% |
| 65 y más | 19,8% |
| La proporción de sexos | |
| Total | 0,98 hombre / mujer |
| Al nacer | 1.05 hombre / mujer |
| Menores de 15 | 1.05 hombre / mujer |
| 15 a 64 años | 1.02 hombre / mujer |
| 65 y más | 0,83 hombre / mujer |
| Nacionalidad | |
| Nacionalidad | holandés |
| Mayor étnico | Holandés 79,3% |
| Menor étnico | Otros europeos 6,3% Indo 4,9% Turcos 2,4% Marroquíes 2,2% Surinamés 2,1% Caribeños 0,9% Chinos 0,3% Iraquíes 0,3% Otros 3,9% |
| Idioma | |
| Oficial | Holandés , frisón , inglés |

Este artículo trata sobre las características demográficas de la población de los Países Bajos , incluida la densidad de población , el origen étnico , el nivel de educación, la salud de la población, el estado económico, las afiliaciones religiosas y otros aspectos de la población .
Tamaño de la población
El Holanda es la 67ª más poblada del país en el mundo, y como de 21 de marzo, 2016, que tiene una población de 17 millones. Al 31 de diciembre de 2020, los Países Bajos tienen una población de 17.474.677. [1]
Entre 1900 y 1950 la población se duplicó de 5,1 a 10,2 millones de personas. De 1951 a 2000 la población aumentó de 10,0 a 15,9 millones de personas, aumentando en una proporción menor. [2]
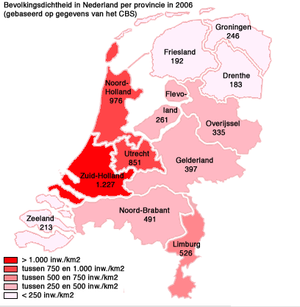
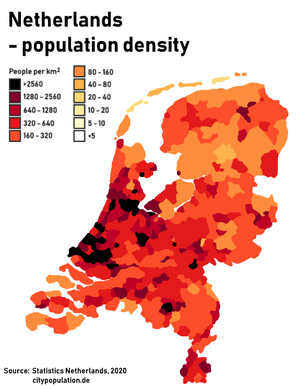

Holanda es el decimosexto país más densamente poblado del mundo y el quinto país más densamente poblado de Europa . Los 17,4 millones [3] de habitantes holandeses se concentran en un área de 41.545 km 2 (16.041 millas cuadradas) incluida la superficie del agua, siendo la superficie terrestre 33.481 km 2 (12.927 millas cuadradas). Esto significa que el país tiene una densidad de población de 521 / km 2 (1.350 / milla cuadrada). La densidad de 500 habitantes / km 2 se alcanzó en el primer semestre de 2014.
Como resultado de estas características demográficas, los Países Bajos han tenido que planificar estrictamente el uso de la tierra . Desde 1946 el Ministerio de Vivienda, Ordenación del Territorio y Medio Ambiente se ocupa de la coordinación nacional del uso del suelo. Debido a su alta densidad de población, los Países Bajos también han ganado tierra al mar mediante el pólder . Entre 1927 y 1968 se creó toda una provincia, Flevoland . Actualmente (2015) alberga a más de 400.000 personas. Gracias a estas políticas, los holandeses han podido combinar altos niveles de densidad de población con niveles extremadamente altos de producción agrícola .
Aunque los Países Bajos están tan densamente poblados, no tiene municipios con una población de más de un millón, aunque los dos municipios más grandes del país obtienen una puntuación muy superior al millón si se cuenta la región de la ciudad completa, incluidas las ciudades satélites vecinas que a menudo son conectado físicamente al municipio principal. Además, las "cuatro grandes ciudades" ( Ámsterdam , Rotterdam , La Haya y Utrecht ) pueden considerarse en muchos sentidos como una única área metropolitana, la Randstad ("ciudad del borde" o "ciudad periférica") con más de 7,5 millones de habitantes alrededor de un "corazón verde" agrícola ( het Groene Hart ).
| vtmi Municipios más grandes de los Países BajosEstadísticas de los Países Bajos [4] | |||||||||
|---|---|---|---|---|---|---|---|---|---|
| Rango | Nombre | Provincia | Música pop. | Rango | Nombre | Provincia | Música pop. | ||
Amsterdam Rotterdam | 1 | Amsterdam | Holanda Septentrional | 872,680 | 11 | Apeldoorn | Gelderland | 163,706 | La Haya Utrecht |
| 2 | Rotterdam | Holanda Meridional | 650,711 | 12 | Haarlem | Holanda Septentrional | 162,864 | ||
| 3 | La haya | Holanda Meridional | 544,766 | 13 | Arnhem | Gelderland | 161,260 | ||
| 4 | Utrecht | Utrecht | 357,179 | 14 | Enschede | Overijssel | 159,934 | ||
| 5 | Eindhoven | Brabante Septentrional | 234,235 | 15 | Amersfoort | Utrecht | 157,286 | ||
| 6 | Groningen | Groningen | 232,826 | dieciséis | Zaanstad | Holanda Septentrional | 156,703 | ||
| 7 | Tilburg | Brabante Septentrional | 219,632 | 17 | Haarlemmermeer | Holanda Septentrional | 155,770 | ||
| 8 | Almere | Flevoland | 211,514 | 18 | 's-Hertogenbosch | Brabante Septentrional | 154,989 | ||
| 9 | Breda | Brabante Septentrional | 184,403 | 19 | Zwolle | Overijssel | 128,617 | ||
| 10 | Nijmegen | Gelderland | 177,818 | 20 | Leiden | Holanda Meridional | 125,434 |
Nacimientos y muertes
| % | Masculino | Edad | Mujer | % |
| 0,36 | 85+ | 1.05 | ||
| 0,60 | 80-84 | 1,18 | ||
| 1,14 | 75-79 | 1,74 | ||
| 1,55 | 70-74 | 1,95 | ||
| 1,93 | 65-69 | 2.13 | ||
| 2.30 | 60-64 | 2,33 | ||
| 2,77 | 55-59 | 2,69 | ||
| 3,73 | 50-54 | 3,60 | ||
| 3,65 | 45-49 | 3,54 | ||
| 3,93 | 40-44 | 3,81 | ||
| 4.27 | 35-39 | 4.08 | ||
| 4.25 | 30-34 | 4.05 | ||
| 3,63 | 25-29 | 3,54 | ||
| 3,04 | 20-24 | 2,93 | ||
| 2,96 | 15-19 | 2,83 | ||
| 3.11 | 10-14 | 2,97 | ||
| 3,20 | 05-09 | 3,06 | ||
| 3.11 | 00-04 | 2,98 | ||
| Datos: Base de datos internacional (2000) | ||||
| Año | Música pop. | ±% |
|---|---|---|
| 1900 | 5.104.000 | - |
| 1910 | 5.858.000 | + 14,8% |
| 1920 | 6.754.000 | + 15,3% |
| 1930 | 7.825.000 | + 15,9% |
| 1940 | 8.834.000 | + 12,9% |
| 1950 | 10.026.773 | + 13,5% |
| 1960 | 11,417,254 | + 13,9% |
| 1970 | 12,957,621 | + 13,5% |
| 1980 | 14.091.014 | + 8,7% |
| 1990 | 14,892,574 | + 5,7% |
| 2000 | 15,863,950 | + 6,5% |
| 2010 | 16,574,989 | + 4,5% |
| 2020 | 17.424.978 | + 5,1% |
| Fuente: Estadísticas de los Países Bajos [5] | ||
La población holandesa está envejeciendo . Además, la esperanza de vida ha aumentado debido a los avances en la medicina y, además, los Países Bajos han experimentado un aumento de la inmigración. A pesar de estos desarrollos combinados con el auge demográfico posterior a la Segunda Guerra Mundial , la baja tasa de natalidad ha provocado un crecimiento demográfico extremadamente bajo: en 2005 se registró el crecimiento demográfico absoluto más bajo desde 1900.
Este desarrollo demográfico tiene consecuencias para la política de salud y seguridad social . A medida que la población holandesa envejece, la proporción de personas en edad laboral, como porcentaje de la población total, disminuye. Importantes asesores de políticas como la CBS (Oficina de Estadística) y la CPB (Oficina de Planificación) han señalado que esto causará problemas con el sistema actual de pensiones de vejez: menos personas trabajarán para pagar las pensiones de vejez, mientras que habrá más personas que reciben esas pensiones. Además, también se prevé que aumenten los costos de la atención médica. Estos desarrollos han provocado que varios gabinetes, en particular el segundo gabinete Balkenende Reformar el sistema de atención médica y seguridad social para aumentar la participación en el mercado laboral y hacer que las personas sean más conscientes del dinero que gastan en atención médica.
En 2003, la tasa anual de natalidad por mil fue más alta en la provincia de Flevoland (15,9). La tasa de fecundidad total a lo largo de toda la vida (TGF) fue más alta en la provincia de Flevoland (2,0) y más baja en la provincia de Limburgo (1,6). El municipio con mayor TGF fue Urk (3,23) seguido de Valkenburg (2,83), Graafstroom (2,79) y Staphorst (2,76). Las TGF más bajas se registraron en Vaals (1,11) y Thorn (1,21). [6]
La población total al 31 de diciembre de 2006 era de 16,356,914. La pérdida de población debido a la emigración neta fue de 35.502 (se estima que entre el 40 y el 50% de los emigrantes eran de etnia no holandesa).
En 2007, había 117.000 inmigrantes (incluidos 7.000 alemanes, 6.000 polacos, 5.000 búlgaros, 3.000 turcos y 2.000 marroquíes) y 123.000 emigrantes. Casi la mitad de los emigrantes eran holandeses nativos, seguidos a distancia por casi 5000 polacos y más de 3000 alemanes. Se observó un aumento de la inmigración neta procedente de la ex URSS, Bulgaria y Rumanía . [7]
La tasa de mortalidad anual fue más baja en los municipios de Valkenburg (2,9 por 1000), Zeewolde (3,2), Renswoude (3,4), Westervoort y Zeevang (ambos 3,9). Las tasas anuales de mortalidad más altas se registraron en Warmond (22,3 por 1000), Laren (19,9) y Doorn (18,8). [8]
El 16,4% del total de nacimientos en 2003 fueron de padres de origen no europeo, aunque sólo representan el 12,4% de la población en el grupo de edad de 25 a 34 años. Por ejemplo, el 3,8% de los nacimientos fueron de etnia marroquí, aunque sólo el 2,26% del grupo de edad de 25 a 34 años. Las cifras respectivas fueron 3,27% y 3,0% para los turcos. La TGF para los marroquíes en 2003 fue de 3,3 mientras que la TGF general fue de 1,73. La TGF fue de 2,3 para los turcos , 1,7 para los surinameses , 1,8 para los arubeños , 3,0 para los africanos y 1,8 para los estadounidenses . [9] (Estas cifras se comparan con una cifra de alrededor de 2,1 necesaria para mantener una cifra de población general estable).
Según Statistics Netherlands, para el año 2007, la TGF para los nacidos en los Países Bajos fue de 1,72 [10] (1,65 en 2000). La TGF de los inmigrantes marroquíes fue de 2,87 (3,22 en 2000) y la de los inmigrantes turcos fue de 1,88 (2,18 en 2000). [11]
Tasa de fertilidad total de 1840 a 1899
La tasa de fecundidad total es el número de hijos nacidos por mujer. Se basa en datos bastante buenos para todo el período. Fuentes: Our World In Data y Gapminder Foundation . [12]
| Años | 1840 | 1841 | 1842 | 1843 | 1844 | 1845 | 1846 | 1847 | 1848 | 1849 | 1850 [12] |
|---|---|---|---|---|---|---|---|---|---|---|---|
| Tasa de fertilidad total en los Países Bajos | 5.11 | 5,09 | 5,06 | 5,04 | 5.02 | 4,99 | 4,99 | 4,99 | 4,99 | 4,99 | 4.89 |
| Años | 1851 | 1852 | 1853 | 1854 | 1855 | 1856 | 1857 | 1858 | 1859 | 1860 [12] |
|---|---|---|---|---|---|---|---|---|---|---|
| Tasa de fertilidad total en los Países Bajos | 4.8 | 4,7 | 4.6 | 4.6 | 4.6 | 4.6 | 4.6 | 4.6 | 4,68 | 4,75 |
| Años | 1861 | 1862 | 1863 | 1864 | 1865 | 1866 | 1867 | 1868 | 1869 | 1870 [12] |
|---|---|---|---|---|---|---|---|---|---|---|
| Tasa de fertilidad total en los Países Bajos | 4.83 | 4.9 | 4,98 | 4,99 | 5.01 | 5.02 | 5,04 | 5,05 | 5,09 | 5.12 |
| Años | 1871 | 1872 | 1873 | 1874 | 1875 | 1876 | 1877 | 1878 | 1879 | 1880 [12] |
|---|---|---|---|---|---|---|---|---|---|---|
| Tasa de fertilidad total en los Países Bajos | 5.16 | 5.19 | 5.23 | 5.27 | 5.31 | 5.34 | 5.38 | 5.42 | 5.39 | 5.35 |
| Años | 1881 | 1882 | 1883 | 1884 | 1885 | 1886 | 1887 | 1888 | 1889 | 1890 [12] |
|---|---|---|---|---|---|---|---|---|---|---|
| Tasa de fertilidad total en los Países Bajos | 5.32 | 5.28 | 5.25 | 5.23 | 5.21 | 5.18 | 5.16 | 5.14 | 5.11 | 5,07 |
| Años | 1891 | 1892 | 1893 | 1894 | 1895 | 1896 | 1897 | 1898 | 1899 [12] |
|---|---|---|---|---|---|---|---|---|---|
| Tasa de fertilidad total en los Países Bajos | 5,04 | 5 | 4,97 | 4,93 | 4.88 | 4.84 | 4,79 | 4,75 | 4.6 |
Estadísticas vitales
La siguiente tabla presenta la evolución desde 1900; haga clic en "mostrar" para mostrar la tabla: [13]
| Población | Nacimientos vivos (total) | Muertes (total) | Cambio natural (total) | Tasa de natalidad ( por mil ) | Tasa de mortalidad ( por mil ) | Cambio natural ( por mil ) | TFR | IMR ( por mil ) | Esperanza de vida hombres | Esperanza de vida mujeres | |
|---|---|---|---|---|---|---|---|---|---|---|---|
| 1900 | 5.142.000 | 162,611 | 92,043 | 70,568 | 31,6 | 17,9 | 13,7 | 4.45 | 155,2 | ||
| 1901 | 5.221.000 | 168,380 | 89,967 | 78.413 | 32,3 | 17.2 | 15.0 | 4.53 | 149,3 | ||
| 1902 | 5.305.000 | 168,728 | 86,248 | 82,480 | 31,8 | 16,3 | 15,5 | 4.46 | 129,9 | ||
| 1903 | 5.389.000 | 170,108 | 83,933 | 86,175 | 31,6 | 15,6 | 16,0 | 4.42 | 135,1 | ||
| 1904 | 5.470.000 | 171.495 | 87,091 | 84,404 | 31,4 | 15,9 | 15,4 | 4.38 | 136,9 | ||
| 1905 | 5.551.000 | 170,767 | 85,016 | 85,751 | 30,8 | 15,3 | 15,4 | 4.29 | 130,9 | ||
| 1906 | 5,632,000 | 170,952 | 83,259 | 87,693 | 30,4 | 14,8 | 15,6 | 4.23 | 127,1 | ||
| 1907 | 5.710.000 | 171,506 | 82,250 | 89,256 | 30,0 | 14,4 | 15,6 | 4.18 | 111,9 | ||
| 1908 | 5.786.000 | 171,861 | 86,936 | 84,925 | 29,7 | 15.0 | 14,7 | 4.13 | 124,8 | ||
| 1909 | 5.862.000 | 170,766 | 80,283 | 90,483 | 29,1 | 13,7 | 15,4 | 4.04 | 99,1 | ||
| 1910 | 5,899,000 | 168.894 | 79,984 | 88,910 | 28,6 | 13,6 | 15,1 | 3,94 | 107,9 | ||
| 1911 | 5.976.000 | 166,527 | 86,786 | 79,741 | 27,9 | 14,5 | 13,3 | 3,81 | 137,2 | ||
| 1912 | 6.054.000 | 170,269 | 74,647 | 95,622 | 28,1 | 12,3 | 15,8 | 3,84 | 87,0 | ||
| 1913 | 6.145.000 | 173,541 | 75,867 | 97,674 | 28,2 | 12,3 | 15,9 | 3,85 | 91,4 | ||
| 1914 | 6.251.000 | 176,831 | 77,739 | 99,092 | 28,3 | 12,4 | 15,9 | 3,86 | 94,8 | ||
| 1915 | 6.364.000 | 167,426 | 79,613 | 87,813 | 26,3 | 12,5 | 13,8 | 3,59 | 86,8 | ||
| 1916 | 6.480.000 | 172,572 | 84,024 | 88,548 | 26,6 | 13,0 | 13,7 | 3,64 | 84,5 | ||
| 1917 | 6.612.000 | 173,112 | 87,273 | 85,839 | 26,2 | 13,2 | 13,0 | 3,59 | 86,8 | ||
| 1918 | 6.705.000 | 167,636 | 115,440 | 52.196 | 25,0 | 17.2 | 7.8 | 3,47 | 103,9 | ||
| 1919 | 6.752.000 | 164,447 | 89,646 | 74,801 | 24,4 | 13,3 | 11,1 | 3.36 | 94,0 | ||
| 1920 | 6.820.000 | 192,987 | 81,525 | 111,462 | 28,3 | 12,0 | 16,3 | 3,89 | 83,3 | ||
| 1921 | 6,921,000 | 189,546 | 77,002 | 112,544 | 27,4 | 11,1 | 16,3 | 3,75 | 86,1 | ||
| 1922 | 7.032.000 | 181,886 | 80,381 | 101,505 | 25,9 | 11,4 | 14,4 | 3,54 | 77,6 | ||
| 1923 | 7.150.000 | 187,512 | 72,809 | 114,703 | 26,2 | 10,2 | 16,0 | 3,55 | 66,8 | ||
| 1924 | 7.264.000 | 182,430 | 71.167 | 111,263 | 25,1 | 9,8 | 15,3 | 3.39 | 60,6 | ||
| 1925 | 7.366.000 | 178,545 | 72,121 | 106,424 | 24,2 | 9,8 | 14,4 | 3,26 | 58,4 | ||
| 1926 | 7.472.000 | 177,498 | 73,357 | 104,141 | 23,8 | 9,8 | 13,9 | 3,18 | 61,1 | ||
| 1927 | 7.576.000 | 175,098 | 77,614 | 97.484 | 23,1 | 10,2 | 12,9 | 3,08 | 58,7 | ||
| 1928 | 7,678,000 | 179.028 | 73,816 | 105,212 | 23,3 | 9,6 | 13,7 | 3,09 | 52,3 | ||
| 1929 | 7.781.000 | 177,216 | 83,224 | 93.992 | 22,8 | 10,7 | 12,1 | 3,00 | 59,0 | ||
| 1930 | 7.884.000 | 182,310 | 71.682 | 110,628 | 23,1 | 9.1 | 14.0 | 3,03 | 50,9 | ||
| 1931 | 7,999,000 | 177,387 | 77,048 | 100,339 | 22,2 | 9,6 | 12,5 | 2,88 | 49,6 | ||
| 1932 | 8.122.000 | 178,525 | 73,059 | 105,466 | 22,0 | 9.0 | 13,0 | 2,83 | 46,3 | ||
| 1933 | 8.237.000 | 171,289 | 72,096 | 99.193 | 20,8 | 8.8 | 12,0 | 2,66 | 43,9 | ||
| 1934 | 8.341.000 | 172,214 | 70.164 | 102,050 | 20,6 | 8.4 | 12,2 | 2,63 | 42,6 | ||
| 1935 | 8.433.000 | 170,425 | 73.660 | 96,765 | 20,2 | 8.7 | 11,5 | 2,57 | 40,0 | ||
| 1936 | 8.516.000 | 171.675 | 73,923 | 97,752 | 20,2 | 8.7 | 11,5 | 2.51 | 38,9 | ||
| 1937 | 8.598.000 | 170,220 | 75,516 | 94,704 | 19,8 | 8.8 | 11,0 | 2,53 | 38,1 | ||
| 1938 | 8.684.000 | 178,422 | 77,043 | 101,379 | 20,5 | 8,9 | 11,7 | 2,63 | 36,5 | ||
| 1939 | 8.781.000 | 180,917 | 75,841 | 105,076 | 20,6 | 8,6 | 12,0 | 2,64 | 33,7 | ||
| 1940 | 8.879.000 | 184,846 | 87,722 | 97,124 | 20,8 | 9,9 | 10,9 | 2,67 | 39,1 | ||
| 1941 | 8,965,000 | 181,959 | 89,716 | 92,243 | 20,3 | 10.0 | 10,3 | 2,61 | 43,6 | ||
| 1942 | 9.042.000 | 189,975 | 76,040 | 113,935 | 21,0 | 8.4 | 12,6 | 2,71 | 39,5 | ||
| 1943 | 9,102,000 | 209,379 | 91,438 | 117,941 | 23,0 | 10.0 | 13,0 | 2,98 | 40,1 | ||
| 1944 | 9.174.000 | 219,946 | 108.087 | 111,859 | 24,0 | 11,8 | 12,2 | 3.13 | 46,3 | ||
| 1945 | 9.262.000 | 209,607 | 141,398 | 68,209 | 22,6 | 15,3 | 7.4 | 2,96 | 79,7 | ||
| 1946 | 9.423.000 | 284,456 | 80,151 | 204.305 | 30,2 | 8.5 | 21,7 | 3,97 | 38,7 | ||
| 1947 | 9,629,000 | 267,348 | 77,646 | 189,702 | 27,8 | 8.1 | 19,7 | 3.70 | 33,5 | ||
| 1948 | 9,800,000 | 247,923 | 72.459 | 175,464 | 25,3 | 7.4 | 17,9 | 3,41 | 29,3 | ||
| 1949 | 9,956,000 | 236,177 | 81,077 | 155,100 | 23,7 | 8.1 | 15,6 | 3,22 | 26,8 | ||
| 1950 | 10.114.000 | 229,718 | 75,929 | 153,789 | 22,7 | 7.5 | 15,2 | 3.10 | 26,7 | 70,3 | 72,6 |
| 1951 | 10,264,000 | 228,405 | 77,560 | 150,845 | 22,3 | 7,6 | 14,7 | 3,05 | 26,7 | 70,2 | 72,8 |
| 1952 | 10,382,000 | 231,888 | 76,346 | 155,542 | 22,3 | 7.4 | 15.0 | 3,09 | 24,1 | 71,0 | 73,3 |
| 1953 | 10,493,000 | 227,964 | 80,901 | 147,063 | 21,7 | 7.7 | 14.0 | 3,03 | 23,7 | 70,4 | 73,0 |
| 1954 | 10,615,000 | 228,173 | 79.623 | 148,550 | 21,5 | 7.5 | 14.0 | 3,03 | 22,6 | 71,0 | 73,8 |
| 1955 | 10,751,000 | 229,222 | 81,708 | 147,514 | 21,3 | 7,6 | 13,7 | 3,03 | 21,6 | 70,9 | 71,4 |
| 1956 | 10,889,000 | 231,492 | 84,809 | 146.683 | 21,3 | 7.8 | 13,5 | 3,05 | 20,2 | 71,0 | 74,1 |
| 1957 | 11,021,000 | 233,892 | 82,961 | 150,931 | 21,2 | 7.5 | 13,7 | 3,08 | 18,4 | 71,4 | 74,6 |
| 1958 | 11.186.000 | 236,859 | 84,491 | 152,368 | 21,2 | 7,6 | 13,6 | 3.11 | 18,5 | 71,5 | 74,8 |
| 1959 | 11,346,000 | 242,518 | 86,072 | 156,446 | 21,4 | 7,6 | 13,8 | 3,17 | 18,1 | 71,2 | 75,2 |
| 1960 | 11,480,000 | 239,128 | 87,825 | 151.303 | 20,8 | 7.7 | 13,2 | 3.12 | 17,9 | 71,4 | 75,3 |
| 1961 | 11,637,000 | 247,407 | 88,321 | 159,086 | 21,3 | 7,6 | 13,7 | 3,22 | 17.0 | 71,5 | 75,7 |
| 1962 | 11,890,000 | 246,150 | 93,969 | 152,181 | 20,7 | 7,9 | 12,8 | 3,18 | 17.0 | 71,0 | 75,6 |
| 1963 | 12,042,000 | 249,879 | 95,734 | 154,145 | 20,8 | 8.0 | 12,8 | 3,19 | 15,8 | 71,0 | 75,8 |
| 1964 | 12,212,000 | 250,914 | 93,437 | 157,477 | 20,5 | 7.7 | 12,9 | 3,17 | 14,8 | 71,3 | 76,3 |
| 1965 | 12,377,000 | 245,216 | 98.026 | 147,190 | 19,8 | 7,9 | 11,9 | 3,04 | 14,4 | 71,1 | 76,1 |
| 1966 | 12,535,000 | 239,611 | 100,516 | 139.095 | 19,1 | 8.0 | 11,1 | 2,90 | 14,7 | 71,0 | 76,1 |
| 1967 | 12,597,000 | 238,678 | 99,792 | 138,886 | 18,9 | 7,9 | 11,0 | 2,81 | 13,4 | 71,2 | 76,6 |
| 1968 | 12,725,000 | 237,112 | 104,989 | 132,123 | 18,6 | 8.3 | 10,4 | 2,72 | 13,6 | 70,9 | 76,4 |
| 1969 | 12,958,000 | 247,588 | 107,615 | 139,973 | 19,1 | 8.3 | 10,8 | 2,75 | 13,2 | 70,9 | 76,3 |
| 1970 | 13,032,000 | 238,912 | 109.619 | 129,293 | 18,3 | 8.4 | 9,9 | 2,57 | 12,7 | 70,8 | 76,5 |
| 1971 | 13,266,000 | 227,180 | 110,243 | 116,937 | 17.1 | 8.3 | 8.8 | 2,36 | 12,1 | 71,0 | 76,8 |
| 1972 | 13,330,000 | 214,133 | 113.576 | 100,557 | 16,1 | 8.5 | 7.5 | 2.15 | 11,7 | 70,8 | 76,5 |
| 1973 | 13,438,000 | 194.993 | 110.682 | 84,311 | 14,5 | 8.2 | 6.3 | 1,90 | 11,5 | 71,3 | 77,1 |
| 1974 | 13,541,000 | 185,982 | 109,250 | 76,732 | 13,7 | 8.1 | 5.7 | 1,77 | 11,3 | 71,6 | 77,6 |
| 1975 | 13,653,000 | 177,876 | 113,737 | 64,139 | 13,0 | 8.3 | 4,7 | 1,66 | 10,6 | 71,5 | 77,7 |
| 1976 | 13,770,000 | 177,090 | 114,454 | 62,636 | 12,9 | 8.3 | 4.5 | 1,63 | 10,7 | 71,5 | 77,9 |
| 1977 | 13,853,000 | 173,296 | 110.093 | 63,203 | 12,5 | 7,9 | 4.6 | 1,58 | 9.5 | 72,1 | 78,5 |
| 1978 | 13,937,000 | 175.550 | 114,415 | 61,135 | 12,6 | 8.2 | 4.4 | 1,58 | 9,6 | 72,0 | 78,5 |
| 1979 | 14.030.000 | 174,979 | 112,565 | 62,414 | 12,5 | 8.0 | 4.4 | 1,56 | 8.7 | 72,5 | 78,9 |
| 1980 | 14,144,000 | 181,294 | 114,279 | 67,015 | 12,8 | 8.1 | 4,7 | 1,60 | 8,6 | 72,5 | 79,2 |
| 1981 | 14,246,000 | 178,569 | 115,515 | 63,054 | 12,5 | 8.1 | 4.4 | 1,56 | 8.3 | 72,7 | 79,3 |
| mil novecientos ochenta y dos | 14.310.000 | 172,071 | 117,264 | 54,807 | 12,0 | 8.2 | 3.8 | 1,50 | 8.3 | 72,8 | 79,4 |
| 1983 | 14.362.000 | 170,246 | 117,761 | 52,485 | 11,9 | 8.2 | 3,7 | 1,47 | 8.4 | 72,9 | 79,6 |
| 1984 | 14,420,000 | 174,436 | 119,812 | 54,624 | 12,1 | 8.3 | 3.8 | 1,49 | 8.3 | 73,0 | 79,7 |
| 1985 | 14,484,000 | 178,136 | 122,704 | 55,432 | 12,3 | 8.5 | 3.8 | 1,51 | 8.0 | 73,1 | 79,7 |
| 1986 | 14,564,000 | 184,513 | 125.307 | 59,206 | 12,7 | 8,6 | 4.1 | 1,55 | 7.7 | 73,1 | 79,6 |
| 1987 | 14,665,000 | 186.667 | 122,199 | 64,468 | 12,7 | 8.3 | 4.4 | 1,56 | 7,6 | 73,5 | 80,1 |
| 1988 | 14,758,000 | 186,647 | 124.163 | 62,484 | 12,6 | 8.4 | 4.2 | 1,55 | 6,8 | 73,7 | 80,2 |
| 1989 | 14,849,000 | 188,979 | 128,905 | 60,086 | 12,7 | 8.7 | 4.0 | 1,55 | 6,8 | 73,7 | 79,9 |
| 1990 | 14,951,000 | 197,965 | 128,824 | 69,115 | 13,2 | 8,6 | 4.6 | 1,62 | 7.1 | 73,8 | 80,1 |
| 1991 | 15.070.000 | 198.665 | 129.958 | 68,707 | 13,2 | 8,6 | 4.6 | 1,61 | 6.5 | 74,1 | 80,2 |
| 1992 | 15.184.000 | 196,734 | 129,887 | 66,847 | 13,0 | 8,6 | 4.4 | 1,59 | 6.3 | 74,3 | 80,3 |
| 1993 | 15,290,000 | 195,748 | 137,795 | 57,953 | 12,8 | 9.0 | 3.8 | 1,57 | 6.3 | 74,0 | 80,0 |
| 1994 | 15,383,000 | 195,611 | 133,471 | 62.140 | 12,7 | 8.7 | 4.0 | 1,57 | 5,6 | 74,6 | 80,3 |
| 1995 | 15,459,000 | 190,513 | 135.675 | 54.838 | 12,3 | 8.8 | 3,5 | 1.531 | 5.5 | 74,6 | 80,4 |
| 1996 | 15,528,000 | 189,521 | 137,561 | 51,960 | 12,2 | 8,9 | 3.3 | 1.529 | 5.7 | 74,7 | 80,4 |
| 1997 | 15,611,000 | 192,443 | 135,783 | 56,660 | 12,3 | 8.7 | 3.6 | 1.562 | 5,0 | 75,2 | 80,6 |
| 1998 | 15,706,000 | 199,412 | 137,968 | 61,444 | 12,7 | 8.8 | 3.9 | 1.628 | 5.2 | 75,2 | 80,7 |
| 1999 | 15,812,000 | 200,445 | 140,487 | 59,958 | 12,7 | 8,9 | 3.8 | 1,652 | 5.2 | 75,3 | 80,5 |
| 2000 | 15.924.000 | 206,619 | 140,527 | 66,092 | 13,0 | 8.8 | 4.2 | 1.723 | 5.1 | 75,5 | 80,6 |
| 2001 | 16,044,000 | 202,603 | 140,377 | 62,226 | 12,6 | 8.7 | 3.9 | 1.710 | 5.4 | 75,8 | 80,7 |
| 2002 | 16.149.000 | 202.083 | 142,355 | 59,728 | 12,5 | 8.8 | 3,7 | 1.731 | 5,0 | 76,0 | 80,7 |
| 2003 | 16,225,000 | 200,297 | 141,936 | 58,361 | 12,3 | 8.7 | 3.6 | 1.747 | 4.8 | 76,2 | 80,9 |
| 2004 | 16,282,000 | 194,007 | 136,553 | 57.454 | 11,9 | 8.4 | 3,5 | 1.726 | 4.4 | 76,9 | 81,4 |
| 2005 | 16,320,000 | 187,910 | 136,402 | 51,508 | 11,5 | 8.4 | 3.2 | 1.708 | 4.9 | 77,2 | 81,6 |
| 2006 | 16,346,000 | 185,057 | 135,372 | 49.685 | 11,3 | 8.3 | 3,0 | 1.720 | 4.4 | 77,6 | 81,9 |
| 2007 | 16,382,000 | 181,336 | 133.022 | 48,314 | 11,1 | 8.1 | 2.9 | 1.718 | 4.1 | 78,0 | 82,3 |
| 2008 | 16,446,000 | 184,634 | 135,136 | 49,498 | 11,2 | 8.2 | 3,0 | 1.773 | 3.8 | 78,3 | 82,3 |
| 2009 | 16,530,000 | 184,915 | 134,235 | 50,680 | 11,2 | 8.1 | 3.1 | 1.790 | 3.8 | 78,5 | 82,7 |
| 2010 | 16,615,000 | 184,397 | 136,058 | 48,339 | 11.1 | 8.2 | 2.9 | 1.796 | 3.8 | 78.8 | 82.7 |
| 2011 | 16,693,000 | 180,060 | 135,741 | 44,319 | 10.8 | 8.1 | 2.7 | 1.759 | 3.6 | 79.2 | 82.8 |
| 2012 | 16,754,000 | 175,959 | 140,813 | 35,146 | 10.5 | 8.4 | 2.1 | 1.723 | 3.7 | 79.1 | 82.8 |
| 2013 | 16,803,000 | 171,341 | 141,245 | 30,096 | 10.2 | 8.4 | 1.8 | 1.679 | 3.8 | 79.4 | 83.0 |
| 2014 | 16,865,000 | 175,181 | 139,073 | 35,434 | 10.3 | 8.2 | 2.1 | 1.713 | 79.9 | 83.3 | |
| 2015 | 16,900,000 | 170,510 | 147,134 | 23,376 | 10.0 | 8.7 | 1.3 | 1.658 | 79.7 | 83.1 | |
| 2016 | 16,979,000 | 172,520 | 148,997 | 23,523 | 10.2 | 8.8 | 1.3 | 1.663 | 79.9 | 83.2 | |
| 2017 | 17,082,000 | 169,836 | 150,214 | 19,622 | 9.9 | 8.8 | 1.1 | 1.619 | 80.1 | 83.4 | |
| 2018 | 17,181,084 | 168,525 | 153,363 | 15,162 | 9.8 | 8.9 | 0.9 | 1.586 | |||
| 2019 | 17,282,163 | 169,680 | 151,885 | 17,795 | 9.8 | 8.8 | 1.0 | 1.574 | |||
| 2020 | 17,407,585 | 168,066 | 168,537 | -471 | 9.6 | 9.7 | -0.1 | ||||
| 2021 (p) | 17,474,693 |
(p) = preliminary
Current natural increase
Source: Centraal Bureau voor de Statistiek[14]
- Number of births for January-June 2020 =
 81,640
 - Number of births for January-June 2021 = 86,189
- Number of deaths for January-June 2020 = 86,238
- Number of deaths for January-June 2021 = 83,839
- Natural growth for January-June 2020 = -4,598
- Natural growth for January-June 2021 = 2,350
Life expectancy from 1850 to 1950
Sources: Our World In Data
1850–1950
| Years | 1850 | 1851 | 1852 | 1853 | 1854 | 1855 | 1856 | 1857 | 1858 | 1859 | 1860[15] |
|---|---|---|---|---|---|---|---|---|---|---|---|
| Life expectancy in the Netherlands | 39.8 | 40.0 | 38.6 | 38.6 | 38.6 | 34.5 | 38.8 | 35.5 | 34.7 | 30.9 | 36.9 |
| Years | 1861 | 1862 | 1863 | 1864 | 1865 | 1866 | 1867 | 1868 | 1869 | 1870[15] |
|---|---|---|---|---|---|---|---|---|---|---|
| Life expectancy in the Netherlands | 36.4 | 38.3 | 38.3 | 37.5 | 36.4 | 33.6 | 39.2 | 37.7 | 40.4 | 37.3 |
| Years | 1871 | 1872 | 1873 | 1874 | 1875 | 1876 | 1877 | 1878 | 1879 | 1880[15] |
|---|---|---|---|---|---|---|---|---|---|---|
| Life expectancy in the Netherlands | 32.9 | 36.5 | 39.2 | 41.3 | 38.2 | 40.4 | 42.0 | 41.1 | 41.9 | 40.3 |
| Years | 1881 | 1882 | 1883 | 1884 | 1885 | 1886 | 1887 | 1888 | 1889 | 1890[15] |
|---|---|---|---|---|---|---|---|---|---|---|
| Life expectancy in the Netherlands | 42.8 | 43.7 | 42.3 | 41.3 | 43.2 | 41.9 | 44.9 | 44.2 | 44.3 | 44.4 |
| Years | 1891 | 1892 | 1893 | 1894 | 1895 | 1896 | 1897 | 1898 | 1899 | 1900[15] |
|---|---|---|---|---|---|---|---|---|---|---|
| Life expectancy in the Netherlands | 44.2 | 43.9 | 45.8 | 46.9 | 46.6 | 48.6 | 49.4 | 49.1 | 49.3 | 48.4 |
| Years | 1901 | 1902 | 1903 | 1904 | 1905 | 1906 | 1907 | 1908 | 1909 | 1910[15] |
|---|---|---|---|---|---|---|---|---|---|---|
| Life expectancy in the Netherlands | 48.7 | 50.6 | 51.5 | 50.9 | 52.1 | 52.7 | 53.5 | 52.7 | 54.9 | 55.1 |
| Years | 1911 | 1912 | 1913 | 1914 | 1915 | 1916 | 1917 | 1918 | 1919 | 1920[15] |
|---|---|---|---|---|---|---|---|---|---|---|
| Life expectancy in the Netherlands | 53.1 | 57.2 | 57.3 | 57.2 | 57.2 | 56.2 | 55.6 | 47.6 | 55.0 | 57.8 |
| Years | 1921 | 1922 | 1923 | 1924 | 1925 | 1926 | 1927 | 1928 | 1929 | 1930[15] |
|---|---|---|---|---|---|---|---|---|---|---|
| Life expectancy in the Netherlands | 59.7 | 59.8 | 62.0 | 62.9 | 63.1 | 63.0 | 62.6 | 63.7 | 62.2 | 64.7 |
| Years | 1931 | 1932 | 1933 | 1934 | 1935 | 1936 | 1937 | 1938 | 1939 | 1940[15] |
|---|---|---|---|---|---|---|---|---|---|---|
| Life expectancy in the Netherlands | 64.3 | 65.4 | 66.0 | 66.6 | 66.5 | 66.7 | 67.0 | 67.4 | 67.7 | 65.4 |
| Years | 1941 | 1942 | 1943 | 1944 | 1945 | 1946 | 1947 | 1948 | 1949 | 1950[15] |
|---|---|---|---|---|---|---|---|---|---|---|
| Life expectancy in the Netherlands | 65.3 | 65.8 | 64.4 | 61.3 | 55.4 | 67.6 | 69.5 | 71.1 | 70.3 | 71.4 |
Migration and ethnicity
Between 1590 and 1800 the estimated share of foreign-born population was consistently above 5%.[16]
According to Eurostat, in 2010 there were 1,800,000 foreign-born residents in the Netherlands, corresponding to 11.1% of the total population. Of these, 1,400,000 (8.5%) were born outside the EU (including those from Dutch colonies) and 428,000 (2.6%) were born in another EU member state. The most common countries of birth being: Belgium, Germany, Poland and the United Kingdom.[17]
As the result of immigration from overseas, the Netherlands have a sizeable minority of non-indigenous peoples. There is also a considerable level of emigration, in majority consisting of former immigrants. In 2005, some 121,000 people left the country, while 94,000 entered it. Out of a total of 101,150 people immigrating into the Netherlands in 2006, 66,658 were from Europe, Oceania, the Americas or Japan, and 34,492 were from other (mostly developing) countries. Out of a total of 132,470 emigrants, 94,834 were going to Europe, Oceania, the Americas or Japan and 37,636 to other countries.[18]
A large number[16] of immigrants come from countries in Western Europe, mostly from the neighbouring countries of Germany and Belgium. There were five subsequent waves of immigration to the Netherlands in recent history.
- In the late-1940s and into the 1950s, following the end of the Second World War, people from the newly independent Republic of Indonesia repatriated or emigrated to the Netherlands - mainly Indo-European (people of mixed European and Indonesian ancestry of Dutch nationality) and supporters of the Republic of South Maluku.
- Between 1960 and 1974, migrants from Southern Europe (i.e. Italy, Portugal, Spain), Turkey and Morocco came to work in the Netherlands as guest workers. They were expected to return to their own country and many did, but others remained and in the 1970s and 1980s were joined by their families. Until 2004, when marriage immigration was restricted, their children usually married others from their home country.[citation needed]
- After 1974, people emigrated from the newly independent Suriname and from the Netherlands Antilles, which remained part of the Kingdom of the Netherlands. In 1974, about forty thousand Surinamese migrated while still retaining Dutch citizenship; between 1975 and 1980 there was a transitional arrangement allowing migration. Antilleans have the Dutch nationality and behave like typical labour migrants, travelling to and from the country in response to the employment available.
- During the 1970s and 1980s, the number of asylum seekers was low, consisting e.g. of Chileans fleeing from political oppression and/or persecution. In the 1990s, asylum migration sharply increased,[19] largely consisting of Yugoslavs, Somalis, Iraqis, Iranians, Ethiopians, Eritreans, Afghans and Vietnamese, fleeing war or famine.[20] Between 2000 and 2014 asylum migration strongly decreased due to the strict "Cohen Law". However, the Syrian Civil War from 2011 resulted in a large influx of Syrian asylum seekers in 2015 and 2016; about ninety thousand Syrians had been granted asylum by 2018.
- Since the 2000s, migrant workers and their families from the newly joined EU member states in Central and Eastern Europe, including: Poland, Romania and Bulgaria, and non-EU states Moldova, Ukraine and the former Yugoslavia.[citation needed] In addition, a number of Spaniards, Greeks, Italians, and Portuguese also migrated due to the impact of the Great Recession in those countries. In 2005, non-Western ethnic population comprised 1.7 million individuals, about 10% of the population in the country.[21]
Illegal immigration to the Netherlands results in automatic deportation[22] but this is often not enforced for various reasons such as unknown country of origin, etc. Many Dutch provinces in 2012 had quotas for deporting illegal immigrants.[23][24][25][26]
By 2017, persons with an immigration background, both western and non-western, formed a majority in Amsterdam (2011), Rotterdam (2013) and The Hague, the three largest cities of the Netherlands.[27]
In 2005, the governmental Sociaal en Cultureel Planbureau in its annual report, noted recurring integration problems for ethnic minorities. While during the economic boom of the 1990s their unemployment and dependence on welfare had strongly decreased, the economic downturn between 2001 and 2004 disproportionally affected immigrant groups. This would be explained by their functioning as a labour reserve, by their lower educational levels and by lower language skills. The report also noted that per capita social interactions between native Dutch and immigrant populations tended to decline over time, partly explainable by the size growth of immigrant groups. Integration levels strongly varied between groups. Surinamese and Antilleans were well economically integrated, but the latter less so culturally. Cultural integration was limited for Turks, but better for Moroccans. Of the asylum seekers, Somalis were among the least integrated into Dutch society, while Iranians were the best integrated with the highest education levels and modern lifestyles. Though the educational levels of the second generation were a significant improvement over those of the first generation, they still lagged behind the native Dutch who themselves on average had been attending ever higher school types. While half of all native Dutch pupils in 2005 proceeded to higher secondary education (HAVO and VWO), for Turks and Moroccans the share was a fifth and for Somali pupils even lower.[21]
In 2007, non-Western groups were generally socio-economically disadvantaged and of the four largest non-Western groups, Turks and Moroccans were the most disadvantaged. In 2006 38.7% of Moroccans and 43.9% of Turks aged 15–64 were in employment, their unemployment rate was about four times the level of the native Dutch (17.2% for Moroccans and 15.1% for Turks), and 30% received some type of social welfare.[16]
After 2008, the financial crisis and the eurocrisis again hit immigrant groups particularly hard. In 2012, at 12% non-Western migrants were six times more likely than native Dutch to receive social welfare benefits, with 2% for the Dutch.[28]
According to a 2010 Statisics Netherlands report, the third generation of non-Western immigrants was predominantly young with 80% being younger than 15, while growing with 10% evey year. The third generation have a similar employment rate as the native Dutch and receive a similar amount of social benefits. The third non-Western generation follow adult education more frequently than both the native Dutch and non-Western immigrants. The non-Western immigrant population as a whole has 1.5 to 2 times the benefit dependence compared to the natives. The non-Western third generation had a rate slightly higher than the native Dutch as crime suspects, but lower than for non-Western immigrants as a whole.[30][31]
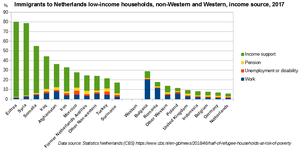
According to Statistics Netherlands, nearly 53% of refugee households have a low income, six times the Netherlands average (8.2%).[29] For Syrian and Eritrean households the share is about 80%. At 33% the poverty risk is lowest among Iranian refugee households. The group of Syrian households at risk of poverty grew from ten thousand (76% of all Syrian households in 2016) to eighteen thousand (79% of all Syrian households) in 2018. Households of Polish, Romanian or Bulgarian origin have a greater than average risk of poverty even though households from these Eastern European countries generally depend on work for their income. Migrant workers from Eastern Europe generally perform low-skilled work while migrants from Western Europe are often highly educated.[29]
Immigrants from foreign countries are divided into several ethnic groups. For example, there are both Russians and Chechens from Russia, Turks and Kurds from Turkey, Serbs and Albanians from Serbia and immigrants from Iran are divided into Persians, Azeris and Kurds.[32]
Ethnic groups
Pie chart showing the ethnic breakdown of Netherlands (2019)
As of 1 January 2020[update], about 4.22 million citizens are of non-Dutch/Frisian origin. A majority of these (51%) are from six backgrounds alone: Turks (inc. Kurds), Moroccans (inc. Berbers), Indonesians (inc. Moluccans), Surinamese, Germans and Poles.[33]
With the huge expansion of the European Union during the 2000s, the Netherlands has seen a rise in the number of immigrants coming from new member states. Migrant workers from these countries are estimated to be about 100,000 as of 2007.[34] Legal migrants from new EU-member states doubled between 2007–11 to 200,000,[35] with estimates totaling up to 300,000. Of the Poles who initially moved to the Netherlands in 2004, about a quarter had returned to Poland by 2006.[36] In addition, a large number of Syrians moved to the Netherlands in the 2010s mostly as refugees, with the population increasing seven-fold between 2014 and 2019. Both Poles and Syrians have overtaken the population of Antilleans during the decade.[33]
As of 1 January 2019[update]:[33]
| National origins or ethnic group | 2019 | 2018 | 2017 | 2016 | 2015 | 2014 | 2013 | 2012 | 2010 | 2009 |
|---|---|---|---|---|---|---|---|---|---|---|
| Dutch (& Frisians) | 13 196 025 (76.36%) | 13 209 225 (76.88%) | 13 218 754 (77.39%) | 13 226 829 (77.90%) | 13 235 405 (78.31%) | 13 234 545 (78.64%) | 13 236 494 (78.89%) | 13 236 618 (79.12%) | 13 215 458 (79.72%) | 13 196 916 (80.05%) |
| Turks (& Kurds) | 409 877 (2.37%) | 404 459 (2.35%) | 400 367 (2.34%) | 397 471 (2.34%) | 396 555 (2.35%) | 396 414 (2.36%) | 392 923 (2.34%) | 392 923 (2.35%) | 384 164 (2.32%) | 378 400 (2.30%) |
| Moroccans (& Berbers) | 402 492 (2.33%) | 396 539 (2.31%) | 391 088 (2.29%) | 385 761 (2.27%) | 380 755 (2.25%) | 374 996 (2.23%) | 368 838 (2.20%) | 362 954 (2.17%) | 349 270 (2.11%) | 341 640 (2.07%) |
| Indos (& Moluccans) | 358 773 (2.08%) | 361 594 (2.10%) | 364 328 (2.13%) | 366 849 (2.16%) | 369 661 (2.19%) | 372 233 (2.21%) | 374 847 (2.23%) | 377 618 (2.26%) | 382 319 (2.31%) | 384 553 (2.33%) |
| Surinamese | 353 909 (2.05%) | 351 681 (2.05%) | 349 978 (2.05%) | 349 022 (2.06%) | 348 662 (2.06%) | 348 291 (2.07%) | 344 734 (2.05%) | 344 734 (2.06%) | 342 016 (2.06%) | 338 519 (2.05%) |
| Germans | 351 552 (2.03%) | 354 136 (2.06%) | 356 875 (2.09%) | 360 116 (2.12%) | 364 125 (2.15%) | 368 512 (2.19%) | ? | ? | 379 017 (2.29%) | 379 518 (2.30%) |
| Poles | 185 497 (1.07%) | 173 050 (1.01%) | 161 158 (0.94%) | 149 831 (0.88%) | 137 794 (0.82%) | 123 003 (0.73%) | 111 121 (0.66%) | 100 775 (0.60%) | 77 178 (0.47%) | 68 844 (0.42%) |
| Dutch Caribbean people ("Antilleans") | 155 492 (0.90%) | 153 469 (0.90%) | 150 981 (0.89%) | 148 926 (0.88%) | 146 855 (0.87%) | 145 499 (0.87%) | 143 992 (0.86%) | 138 113 (0.83%) | 134 486 (0.82%) | |
| Belgians | 119 769 (0.69%) | 118 725 (0.69%) | 117 495 (0.69%) | 116 389 (0.69%) | 115 687 (0.68%) | ? | ? | ? | ? | 112 529 (0.68%) |
| Syrians | 98 090 (0.57%) | 90 771 (0.53%) | 72 903 (0.43%) | 43 838 (0.26%) | 22 568 (0.13%) | 13 744 (0.08%) | 11 665 (0.07%) | 11 025 (0.07%)y | 10 263 (0.06%) | 9 976 (0.06%) |
| Former Soviets[a] | 92 128 (0.53%) | 84 498 (0.49%) | 80 013 (0.47%) | 76 102 (0.45%) | ? | ? | ? | ? | 52 563 (0.32%) | |
| British | 91 154 (0.53%) | 88 390 (0.51%) | 86 293 (0.51%) | 84 466 (0.50%) | 82 879 (0.49%) | ? | ? | ? | ? | 77 733 (0.47%) |
| Former Yugoslavs[b] | 87 536 (0.51%) | 85 504 (0.50%) | 84 243 (0.50%) | 83 261 (0.49%) | ? | ? | ? | ? | 77 995 (0.47%) | |
| Chinese | 77 648 (0.45%) | 74 234 (0.43%) | 71 229 (0.42%) | 68 697 (0.40%) | 66 088 (0.39%) | ? | ? | ? | ? | 50 681 (0.31%) |
| Iraqis | 63 008 (0.36%) | 61 255 (0.36%) | 59 497 (0.35%) | 56 269 (0.33%) | ? | ? | ? | ? | ? | 49 234 (0.30%) |
| Italians | 56 645 (0.33%) | 53 703 (0.31%) | 50 925 (0.30%) | 48 366 (0.28%) | ? | ? | ? | ? | ? | ? |
| Afghans | 49 122 (0.28%) | 47 776 (0.28%) | 46 701 (0.27%) | 44 339 (0.26%) | ? | ? | ? | ? | ? | 37 739 (0.23%) |
| Indians | 48 724 (0.28%) | 36 818 (0.22%) | 32 682 (0.19%) | ? | ? | ? | ? | ? | ? | |
| French | 47 009 (0.27%) | 45 558 (0.27%) | 43 836 (0.26%) | 42 070 (0.25%) | ? | ? | ? | ? | ? | ? |
| Spaniards | 46 741 (0.27%) | 42 926 (0.25%) | 41 572 (0.24%) | ? | ? | ? | ? | ? | ? | |
| Americans | 44 399 (0.26%) | 40 022 (0.23%) | 38 494 (0.23%) | ? | ? | ? | ? | ? | ? | |
| Iranians (Persians, Azeris and Kurds) | 44 379 (0.26%) | 42 464 (0.25%) | 40 893 (0.24%) | 38 458 (0.23%) | ? | ? | ? | ? | ? | 30 617 (0.19%) |
| Somalis | 39 947 (0.23%) | 39 737 (0.23%) | 39 457 (0.23%) | 39 465 (0.23%) | ? | ? | ? | ? | ? | 21 753 (0.13%) |
| Bulgarians | 34 809 (0.20%) | 27 729 (0.16%) | 25 520 (0.15%) | ? | ? | ? | ? | ? | ? | |
| Romanians | 34 185 (0.20%) | 25 551 (0.15%) | 23 020 (0.14%) | ? | ? | ? | ? | ? | ? | |
| Brazilians | 30 104 (0.17%) | 24 725 (0.14%) | 23 675 (0.14%) | ? | ? | ? | ? | ? | ? | |
| Portuguese | 27 450 (0.16%) | 25 637 (0.15%) | 24 930 (0.15%) | ? | ? | ? | ? | ? | ? | |
| Egyptians | 26 152 (0.15%) | 23 956 (0.14%) | 23 198 (0.14%) | ? | ? | ? | ? | ? | ? | |
| Greeks | 25 709 (0.15%) | 22 141 (0.13%) | 20 769 (0.12%) | ? | ? | ? | ? | ? | ? | |
| Hungarians | 24 898 (0.14%) | 22 870 (0.13%) | 22 080 (0.13%) | ? | ? | ? | ? | ? | ? | |
| Ghanaians | 24 460 (0.14%) | 23 430 (0.14%) | 23 168 (0.14%) | ? | ? | ? | ? | ? | ? | |
| Pakistanis | 23 855 (0.14%) | 22 897 (0.13%) | 22 137 (0.13%) | 21 447 (0.13%) | ? | ? | ? | ? | ? | 18 636 (0.11%) |
| Ethiopians | 23 777 (0.14%) | 19 528 (0.11%) | 16 347 (0.10%) | ? | ? | ? | ? | ? | ? | |
| South Africans (Afrikaners) | 23 738 (0.14%) | 20 859 (0.12%) | 19 877 (0.12%) | ? | ? | ? | ? | ? | ? | |
| Vietnamese (Kinh) | 23 488 (0.14%) | 22 023 (0.13%) | 21 435 (0.13%) | ? | ? | ? | ? | ? | 18 913 (0.11%) | |
| Filipinos | 23 128 (0.13%) | 22 000 (0.13%) | 20 937 (0.12%) | 20 073 (0.12%) | ? | ? | ? | ? | ? | ? |
| Cape Verdeans | 22 632 (0.13%) | 22 285 (0.13%) | 22 157 (0.13%) | ? | ? | ? | ? | ? | ? | |
| Thai | 21 364 (0.12%) | 20 106 (0.12%) | 19 513 (0.11%) | ? | ? | ? | ? | ? | ? | |
| Hong Kongers | 18 367 (0.11%) | 18 357 (0.11%) | 18 300 (0.11%) | ? | ? | ? | ? | ? | ? | |
| Colombians | 18 351 (0.11%) | 16 607 (0.10%) | 15 892 (0.09%) | ? | ? | ? | ? | ? | ? | |
| Australians | 17 349 (0.10%) | 16 597 (0.10%) | 16 127 (0.09%) | ? | ? | ? | ? | ? | ? | |
| Canadians | 16 614 (0.10%) | 16 240 (0.09%) | 15 944 (0.09%) | 15 625 (0.09%) | ? | ? | ? | ? | ? | ? |
| Austrians | 16 055 (0.09%) | 15 777 (0.09%) | 15 674 (0.09%) | ? | ? | ? | ? | ? | ? | |
| Rest of Sub-Saharan Africa | 108 621 (0.63%) | 97 026 (0.57%) | 91 797 (0.54%) | ? | ? | ? | ? | ? | ? | |
| Rest of Europe | 77 245 (0.45%) | 68 592 (0.40%) | 65 849 (0.39%) | ? | ? | ? | ? | ? | ? | |
| Rest of Americas (except Caribbean) | 52 425 (0.30) | 47 048 (0.28%) | 45 256 (0.27%) | ? | ? | ? | ? | ? | ? | |
| Rest of North Africa and Middle East | 55 180 (0.32%) | 46 231 (0.27%) | 44 059 (0.26%) | ? | ? | ? | ? | ? | ? | |
| Rest of East and Southeast Asia | 38 279 (0.22%) | 34 562 (0.20%) | 33 473 (0.20%) | ? | ? | ? | ? | ? | ? | |
| Rest of Caribbean | 28 861 (0.17%) | 21 514 (0.13%) | 20 956 (0.12%) | ? | ? | ? | ? | ? | ? | |
| Rest of South Asia | 18 672 (0.11%) | 17 448 (0.10%) | 16 762 (0.10%) | ? | ? | ? | ? | ? | ? | |
| Rest of Oceania | 6 479 (0.04%) | 6 062 (0.04%) | 5 916 (0.03%) | ? | ? | ? | ? | ? | ? | |
| Others | 1 094 826 (6.48%) | 1 587 433 (9.43%) | 1 437 462 (8.57%) | 1 437 462 (8.59%) | 1 387 255 (8.37%) | 715 055 (4.34%) | ||||
| Total | 17 282 163 | 17 181 084 | 17 081 507 | 16 979 120 | 16 900 726 | 16 829 289 | 16 779 575 | 16 730 348 | 16 577 612 | 16 486 587 |
| Region of the World | 2019 | 2018 | 2017 | 2016 |
|---|---|---|---|---|
| Netherlands | 13 196 025 (76.36%) | 13 209 225 (76.88%) | 13 218 754 (77.39%) | 13 226 829 (77.90%) |
| Europe (Except Netherlands) | 1 318 382 (7.63%) | 1 237 807 (7.25%) | 1 204 908 (7.10%) | |
| North Africa and Middle East | 1 148 300 (6.64%) | 1 081 636 (6.33%) | 1 033 393 (6.09%) | |
| East and South East Asia | 561 047 (3.25%) | 551 542 (3.23%) | 548 340 (3.23%) | |
| Caribbean and Suriname | 538 262 (3.11%) | 524 961 (3.07%) | 520 959 (3.07%) | |
| Sub-Saharan Africa | 243 175 (1.41%) | 222 585 (1.30%) | 212 811 (1.25%) | |
| Americas (Except Caribbean and Suriname) | 161 893 (0.94%) | 144 346 (0.85%) | 138 942 (0.82%) | |
| South Asia | 91 251 (0.53%) | 76 403 (0.45%) | 70 891 (0.42%) | |
| Oceania | 22 828 (0.14%) | 22 659 (0.13%) | 22 043 (0.13%) |
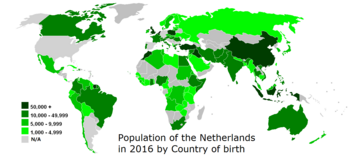
| Nationality | Population (2020)[37] |
|---|---|
| 416,864 | |
| 408,864 | |
| 356,402 | |
| 356,029 | |
| 349,284 | |
| 198,024 | |
| 121,019 | |
| 105,440 | |
| 94,915 | |
| 81,534 | |
| 64,653 | |
| 60,013 | |
| 56,462 | |
| 50,403 | |
| 49,116 | |
| 48,926 | |
| 47,797 | |
| 46,807 | |
| 40,251 | |
| 40,216 | |
| 39,340 | |
| 33,348 | |
| 28,802 | |
| 28,100 | |
| 27,504 | |
| 26,354 | |
| 26,172 | |
| 25,642 | |
| 25,453 | |
| 25,050 |
Sources of immigration
| Rank | Country | Number | Percentage |
|---|---|---|---|
| 1 | 10,352 | 9.6 | |
| 2 | 7,041 | 6.5 | |
| 3 | 5,244 | 4.9 | |
| 4 | 4,920 | 4.6 | |
| 5 | 4,885 | 4.5 | |
| 6 | 4,800 | 4.4 | |
| 7 | 3,506 | 3.2 | |
| 8 | 3,308 | 3.1 | |
| 9 | 3,187 | 2.9 | |
| 10 | 2,935 | 2.7 | |
| Top 10 total | 50,178 | 46.4 | |
| Other | 57,857 | 53.6 | |
| Total | 108,035 | 100 |
Emigration
The Netherlands has seen considerable emigration. In the 1950s 560,000[citation needed] people migrated to the United States, South Africa, Australia, Canada and New Zealand, leaving their war-torn and overpopulated home country behind. At least 60,000 of these migrants were Indo-European (mixed Dutch-Indonesian) repatriates that moved on, mostly to the United States, after being repatriated to the Netherlands from the former Dutch East Indies during and after the Indonesian revolution.
In 2005 some 121,000 people migrated from the Netherlands. There is considerable migration towards neighbouring states, Belgium, Germany and the United Kingdom and to the Netherlands Antilles. Furthermore, almost half of the current emigration consists of people returning to their country of birth, including rejected asylum seekers, after the more stringent migration laws were implemented.
Education by background
According to a 2016 study by Statistics Netherlands, students with a non-western background generally study at a lower level of secondary education. 48 percent of those with a Dutch background were at HAVO or VWO level at third year, compared to 23 percent for Dutch Turks, 28 percent for Dutch Moroccans, 35 percent for Dutch Surinamese and 31 percent for Dutch Antilleans. Some backgrounds fared better: over 40 percent of Dutch Afghans studied at HAVO/VWO level, and for Dutch Iranians the rate was 50 percent, which was above native Dutch students.[39]
Demographic statistics
Demographic statistics according to the World Population Review in 2019.[40]
- One birth every 3 minutes
- One death every 4 minutes
- One net migrant every 31 minutes
- Net gain of one person every 11 minutes

The following demographic statistics are from Cia World Factbook.[41]
- Population
- 17,337,403 (February 2021 est.) Country comparison to the world: 70th
- Age structure
- 0-14 years: 16.11 (male 1,425,547 /female 1,358,894)
- 15-24 years: 11.91% (male 1,049.000 /female 1,008,763)
- 25-54 years: 38.47% (male 3,334,064 /female 3,313,238)
- 55-64 years: 13.69% (male 1,177,657/female 1,188,613)
- 65 years and over: 19.82% (male 1,558,241/female 1,866,380) (2020 est.)
- Birth rate
- 11.0 births/1,000 population (2021 est.) Country comparison to the world: 178th
- Death rate
- 9.22 deaths/1,000 population (2021 est.) Country comparison to the world: 60th
- Total fertility rate
- 1.78 children born/woman (2021 est.) Country comparison to the world: 157th
- Net migration rate
- 1.9 migrant(s)/1,000 population (2021 est.) Country comparison to the world: 53rd
- Median age
- total: 42.8 years. Country comparison to the world: 32nd
- male: 41.6 years
- female: 44.0 years (2020 est.)
- Mother's mean age at first birth
- 29.8 years (2017 est.)
- Ethnic groups
- Dutch 76.9%, EU 6.4%, Turkish 2.4%, Moroccan 2.3%, Indonesian 2.1%, German 2.1%, Surinamese 2%, Polish 1%, other 4.8% (2018 est.)
- Population growth rate
- 0.37% (2021 est.) Country comparison to the world: 168th
- Languages
- Dutch (official)
- note: Frisian is an official language in the province of Friesland; Frisian, Low Saxon, Limburgish, Romani, and Yiddish have protected status under the European Charter for Regional or Minority Languages; Dutch is the official language of the three special municipalities of the Caribbean Netherlands; English is a recognized regional language on Sint Eustatius and Saba; Papiamento is a recognized regional language on Bonaire
- Religions
- Roman Catholic 23.6%, Protestant 14.9% (includes Dutch Reformed 6.4%, Protestant Church of the Netherlands 5.6%, Calvinist 2.9%), Islam 5.1%, other 5.6% (includes Hindu, Buddhist, Jewish), none 50.7% (2017 est.)
- Life expectancy at birth
- total population: 81.9 years (2020 est.) Country comparison to the world: 30th
- male: 79.7 years (2020 est.)
- female: 84.3 years (2020 est.)
- Dependency ratios
- total dependency ratio: 55.6 (2020 est.)
- youth dependency ratio: 24.4 (2020 est.)
- elderly dependency ratio: 31.2 (2020 est.)
- potential support ratio: 3.2 (2020 est.)
- School life expectancy (primary to tertiary education)
- total: 19 years
- male: 18 years
- female: 19 years (2018)
- Unemployment, youth ages 15–24
- total: 7.2%. Country comparison to the world: 130th
- male: 7.7%
- female: 6.6% (2018 est.)
Religion
In 2013, Statistics Netherlands found that 26% of the population identified as Roman Catholic, 16% as Protestant, 5% as Muslim, and 6% as "other" (the last includes other Christian denominations, Hindus 0.6%, Jews 0.1%, and Buddhists 0.4%). The agency interviewed 355,237 people in the period 2010–2013.[42] In 2019 the Central Bureau of Statistics reported that for the first time non-religious people were in the majority in the Netherlands. Only 49% of people older than 15 years reported to be religious; in 2012 that was still 54%. The largest religion was still Catholicism (24%), while 5% identified with Islam.[43]
Religion in Netherlands (2018) by Statista[44]
Language
The main language is Dutch, while Frisian (known as West Frisian outside of the Netherlands) is also a recognized language in the province of Friesland and is used by the government and schools there. Several dialects of Low Saxon (Nedersaksisch in Dutch) are spoken in much of the north and east and are recognized by the Netherlands as regional languages according to the European Charter for Regional or Minority Languages. Another Dutch dialect granted the status of regional language is Limburgish, which is spoken in the south-eastern province of Limburg. Major immigrant languages are Indonesian, Turkish, Arabic, Berber, Papiamento, German and Polish.
See also
- Dutch people
- Islam in the Netherlands
- Immigration to Europe
- List of countries by immigrant population
- Netherlands
- Indo people
Notes
- ^ Primarily Estonians, Lithuanians, Latvians, Russians and Ukrainians
- ^ Bosniaks & Bosnians, Croats, Macedonians, Montenegrins, Serbs, Slovenes, and other Yugoslavs collectively
- ^ a b c In 2004, the Dutch Reformed Church (NHK) and the Reformed Churches in the Netherlands (GKN) merged to form the Protestant Church in the Netherlands (PKN) and officially no longer exist. However, many people still tend to give their older affiliation even after the merger. People who declared themselves simply as belonging to the Protestant Church in the Netherlands did not give an information about belonging to an older affiliation.[45]
References
- ^ "CBS Statline". opendata.cbs.nl.
- ^ CBS Statline - Population; history. Statistics Netherlands. Retrieved on 2009-03-08.
- ^ Netherlands, Statistics. "Population counter". Cbs.nl. Retrieved 5 October 2017.
- ^ "CBS Statline". opendata.cbs.nl.
- ^ "Population counter of the Netherlands".
- ^ Netherlands, Statistics. "Largest families in Urk". Cbs.nl. Retrieved 5 October 2017.
- ^ Netherlands, Statistics. "Population growth 46 thousand in 2007". Cbs.nl. Retrieved 5 October 2017.
- ^ [1][permanent dead link]
- ^ "Archived copy" (PDF). Archived from the original (PDF) on 2007-06-30. Retrieved 2007-06-30.CS1 maint: archived copy as title (link)
- ^ "Bevolkingsprognose 2007–2014: tijdelijk hogere groei" (PDF). Cbs.nl. Archived from the original (PDF) on 2016-03-03. Retrieved 5 October 2017.
- ^ Charles F. Westoff; Tomas Frejka. "Fertility and Religiousness Among European Muslims". Paa2007.princeton.edu. Archived from the original on 2007-06-28. Retrieved 5 October 2017.
- ^ a b c d e f g Max Roser (2014), "Total Fertility Rate around the world over the last centuries", Our World In Data, Gapminder Foundation, archived from the original on 2018-08-07, retrieved 2019-02-01
- ^ "CBS Statistics Netherlands". Archived from the original on November 14, 2010.
- ^ "Population". Centraal Bureau voor de Statistiek. Retrieved 28 July 2021.
- ^ a b c d e f g h i j "Life expectancy". Our World in Data. Retrieved 2018-08-28.
- ^ a b c "Focus migration - country profile - Netherlands". focus-migration.hwwi.de. Hamburgisches WeltWirtschaftsinstitut (HWWI). November 2007. Archived from the original on 30 April 2017. Retrieved 6 April 2017.
- ^ VASILEVA, Katya. "6.5% of the EU population are foreigners and 9.4% are born abroad (34/2011)" (PDF). Eurostat. Archived from the original (PDF) on 2012-01-28.
- ^ "CBS StatLine - External migration; sex, age (31 dec), marital status and country of birth". cbs.nl.
- ^ "Substantial increase asylum seekers". cbs.nl. 29 January 2015. Retrieved 6 April 2017.
- ^ Nieuwe etnische groepen in Nederland. Een onderzoek onder vluchtelingen en statushouders uit Afghanistan, Iran, Ethiopië, Eritrea, Somalië en Vietnam.
- ^ a b "Jaarrapport Integratie 2005 - SCP Summary". www.scp.nl (in Dutch). pp. 1–3. Archived from the original on 2018-09-16. Retrieved 2018-09-15.
- ^ "Dutch float 'migrant prison' scheme". BBC. Retrieved 2012-05-05.
- ^ "Anti-immigrant website fans flames in the Netherlands". Vancouver Sun. Archived from the original on 2012-04-29. Retrieved 2012-05-05.
- ^ "Dutch Police to Scan Fingerprints in Checks for Illegal Immigrants". Voice of America. Retrieved 2012-05-05.
- ^ "Government gets tougher with illegal immigrants". Radio Netherlands. Archived from the original on 2012-04-28. Retrieved 2012-05-05.
- ^ "Clash over illegal alien arrest quota". Radio Netherlands. Archived from the original on 2012-04-01. Retrieved 2012-05-05.
- ^ Statistiek, Centraal Bureau voor de. "CBS". Centraal Bureau voor de Statistiek (in Dutch). Retrieved 2018-09-17.
- ^ "Annual Integration Report 2013 Summary". www.scp.nl. SCP. p. 191. Archived from the original on 2018-09-16. Retrieved 2018-09-16.
- ^ a b c Netherlands, Statistics. "Half of refugee households at risk of poverty". Statistics Netherlands. Retrieved 2018-11-18.
- ^ Steven de Jong, "PVV-plan is prachtig. Derde generatie kan imago ‘allochtoon’ opkrikken", NRC Handelsblad, 29 June 2011
- ^ "Verkenning niet-westerse derde generatie" (PDF). Papers van Het Centrum voor Beleidsstatistiek. Den Haag: Centraal Bureau voor de Statistiek: 5 / Samenvattning. 2010. ISSN 1877-3028. Archived from the original on 16 November 2010.
- ^ Netherlands, Statistics. "CBS". Statistics Netherlands.
- ^ a b c "CBS StatLine - Bevolking; generatie, geslacht, leeftijd en herkomstgroepering, 1 januari". Statline.cbs.nl. Retrieved 5 October 2017.
- ^ "Donner: 100.000 Oost-Europeanen werken in Nederland". Volkskrant.nl. 2007-11-25. Retrieved 2007-11-25.
- ^ "Aantal Midden- en Oost-Europeanen in vijf jaar tijd verdubbeld". CBS. 2011-07-25. Retrieved 2011-11-29.
- ^ "Immigratie Oost-Europeanen blijft hoog". CBS. 2007-11-28. Retrieved 2007-11-28.
- ^ "CBS Statline". opendata.cbs.nl.
- ^ "CBS Statline". opendata.cbs.nl.
- ^ Jaarraport Integratie 2016 (PDF), CBS
- ^ "Netherlands Population 2019", World Population Review
- ^ "The World FactBook - Netherlands", The World Factbook, February 2, 2021
- ^ Schmeets, Hans (2014). De religieuze kaart van Nederland, 2010-2013 (PDF). Centraal Bureau voor de Statistiek. p. 4. Retrieved 23 April 2015.
- ^ "Niet-religieuze Nederlander is nu officieel in de meerderheid". October 22, 2018.
- ^ https://www.statista.com/statistics/527782/population-of-the-netherlands-by-religion/
- ^ Schmeets, Hans; Mensvoort, Carly van (2011). Religieuze betrokkenheid van bevolkingsgroepen, 2010–2014 (PDF). Centraal Bureau voor der Statistiek. Retrieved 21 February 2018.
External links
- CIA World Factbook data
- CBS Dutch Bureau of Statistics